Scaling the size of the CO2 error in Friedlingstein et al

The error in Friedlingstein et al (2021) is much larger than expected. Friedlingstein et al Page 4: “total anthropogenic CO2 emission of 10.2 ± 0.8 GtC yr-1 (37.4 ± 2.9 GtCO2).”

The amounts above are their calculation, not mine.

Friedlingstein et al reported their estimate for 1 year’s (2020) increase for human fossil fuel emissions, land use and cement = 37.4 +- 2.9 Gt CO2. This is their estimate of emissions not net emissions. Net CO2 absorption has not been subtracted.

Follow this simple arithmetic:

• Using NOAA Mauna Loa data only (no estimates, no theories, no models, no assumptions.) Reported in micromoles/mole = ppm.
• MLO did not report CO2 flask measurements on Jan 1, 2020
• 2 Jan 2020, MLO reported 4 CO2 flask measurements for Jan 2, 2020. Average 412.9875 ppm
• 31 Dec 2020, MLO reported 4 CO2 flask measurement for Dec 31, 2020. Average 415.5225 ppm
• CO2 increase due to all sources human and natural combined for year 2020 is 2.535 ppm, (i.e., 415.5 minus 412.9875)
• 2.535 ppm CO2 per year times 7.76 Gt CO2 per ppm of CO2 = 19.679 Gt CO2 added to the atmosphere in 2020 from all sources human and natural.

• Thus, net CO2 added by humans cannot exceed 19.679 Gt CO2 in 2020, because this amount includes net CO2 additions by all sources.

• Net global average CO2 concentration reported by Mauna Loa on 31 December 2020, the average of 4 measurements that day was 415.5225 ppm. Multiply by 7.76 Gt per ppm = 3224.455 Gt CO2 total CO2 in atmosphere.

• Then, 19.679 / 3224.455 = 0.006103. Multiply by 100 = 0.610%.

• Net Human CO2 added to air in 2020 cannot exceed 0.610% of total CO2 for 2020. This 0.61% includes net CO2 emissions and net CO2 absorptions from humans including cement, net CO2 from ocean, net CO2 from land, rivers, lakes, CO2 from rotting and decay, net CO2 from biosphere, etc.

37.4 Gt CO2 is the Friedlingstein et al estimate of human emissions only for 2020. It is an excessively complicated estimate.   If you read the Friedlingstein et al paper you will see the complications, uncertainties, and assumptions. But that amount is human emissions only and only emissions, that is CO2 absorptions have not been subtracted from their estimated human CO2 emissions.

Net total CO2 added in 2020 was measured 19.679 Gt CO2. 37.4/19.7 = 52.7%, but this is an apples and oranges comparison. 19.7 is total emissions minus total absorption. 37.4 is human only and emissions only. Friedlingstein et al has a major problem.  We do not know how much of that 37.4 Gt CO2 human emission was absorbed during 2020. But we do know that net human emissions cannot exceed 19.679 Gt CO2.

It is easily proven and observed that ocean is both a CO2 sink and a CO2 source. CO2 flux is non-stop in both directions, into and out of Earth’s surface. Earth’s surface is over 70% ocean. CO2 gas molecules continuously collide with ocean surface, day and night, regardless of season, temperature, or location; some of that CO2 is emitted back into air, and some is retained in the surface. The partition ratio of CO2 between gas in the surface versus gas above the surface is the Henry’s Law coefficient.  The coefficient is a simple ratio of CO2 moles or mass; it varies with the local surface temperature.  The resulting ratio is a dimensionless, intensive property of matter.  Adding more CO2 to the air or to the ocean surface does not change the CO2 ratio.  Diffusivity of a gas in a liquid is a function of the mass of the gas, specifically the inverse of the square root of the molecular weight of the gas.  Humans, volcanoes, biosphere, etc., adding CO2 to the atmosphere does not change the Henry’s ratio or diffusivity of the CO2 gas into the ocean surface.  The concentration of CO2 gas in the ocean surface and in the air at a given local surface temperature is given by the Henry’s Law coefficient plus or minus temporary perturbations due to alkalinity, surface or air disturbances due to winds, currents, and salinity at that location. The net amount of biosphere CO2 flux, another perturbation, is also non-stop in both directions when CO2 emissions due to decay are included.  These perturbations adjust by CO2 emission or CO2 absorption and rapidly return to the Henry’s Law CO2 partition ratio. 

Friedlingstein et al say on Page 9: “Global emissions and their partitioning among the atmosphere, ocean and land are in reality in balance.”

Friedlingstein et al calculate on page 32, section 3.4.2, “The observed stability of the airborne fraction over the 1960-2020 period indicates that the ocean and land CO2 sinks have been removing on average about 55% of the anthropogenic emissions (see sections 3.5 and 3.6).”

Apparently, Friedlingstein et al believe nature is in balance, except for humans. Apparently, they believe that nature, which balances 3224.455 Gt CO2 total CO2 in atmosphere by continuous emissions and absorptions, is unable to balance an additional estimated 37.4 Gt CO2 from humans.  Nature is already balancing over 86 times more CO2 than their estimation of human emissions, (i.e., 3224.5/37.4) but for some unexplained reason they believe nature is unable to balance the relatively tiny human CO2 perturbation, a human amount which is much less than 0.61% of the total, (i.e., 19.7/3224.5) because that 0.61% includes net CO2 emissions from all sources and sinks, human and natural.

Even the above example understates the size of their error. Since net human emissions would be a cumulative net of two fluxes, if there were a method to measure it, and since net global average CO2 concentration (i.e., NOAA Mauna Loa) is the net of two giant CO2 fluxes in opposite vector directions, then we should compare these data as integral areas. (That is still an apples and oranges comparison because we only have the estimate of human emissions, not net human emissions. But at least the comparison would be in the right order of magnitude.)

Follow this simple arithmetic:

  • Friedlingstein et al estimate 37.4 Gt human CO2 emissions for 2020.  For avoidance of doubt, this is not emission minus absorption.)
  • 1 ppm CO2 equals 7.76 Gt CO2
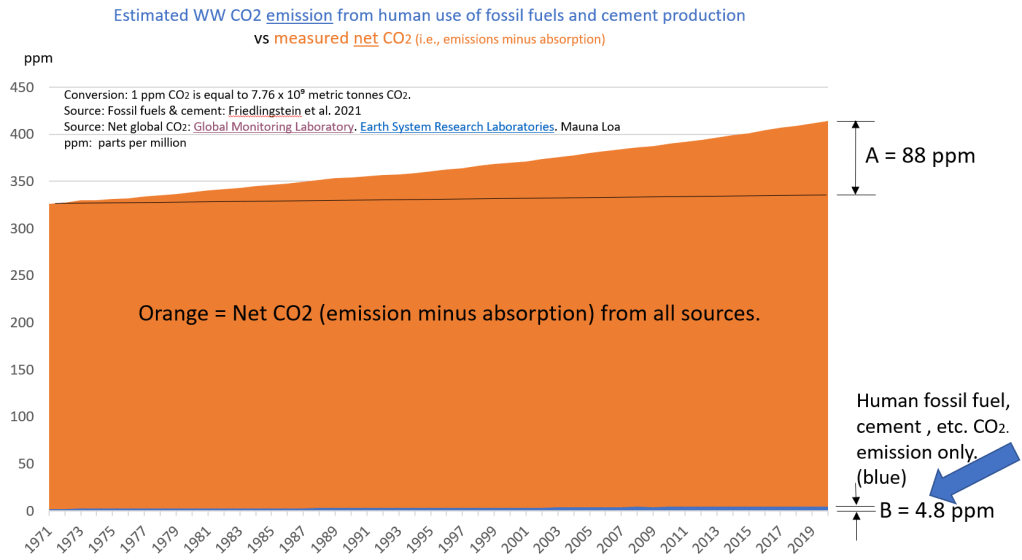
  • 37.4 Gt divided by 7.76 = 4.8195 ppm human CO2 emissions for 2020, call it 4.8 ppm

Then the comparison between total CO2 versus Friedlingstein et al estimated human CO2 emission would look something like the following graphic. We compare the entire area of the orange quadrangle to the area of the thin blue quadrangle.  Absorptions of human CO2 emissions have not been subtracted. Nevertheless, it should be obvious that B is not causing A, and the orange area is enormously larger than the blue area.

Human emissions cannot be driving the growth rate (slope) observed in net global average CO2 concentration. 

Net global average CO2 concentration in air today is the same as it would be if humans never existed. 
References

  1. Friedlingstein et al. (2021) https://essd.copernicus.org/preprints/essd-2021-386/essd-2021-386.pdf
  2. K.W. Thoning, A.M. Crotwell, and J.W. Mund (2022), Atmospheric Carbon Dioxide Dry Air Mole Fractions from continuous measurements at Mauna Loa, Hawaii, Barrow, Alaska,  American Samoa and South Pole. 1973-2021, Version 2022-05 National Oceanic and Atmospheric Administration (NOAA), Global Monitoring Laboratory (GML), Boulder, Colorado, USA.  https://doi.org/10.15138/yaf1-bk21
  3. Dlugokencky, E.J., J.W. Mund, A.M. Crotwell, M.J. Crotwell, and    K.W. Thoning (2021), Atmospheric Carbon Dioxide Dry Air Mole Fractions from the NOAA GML Carbon Cycle Cooperative Global Air Sampling Network, 1968-2020, Version: 2021-07-30, https://doi.org/10.15138/wkgj-f215 download file here: https://budbromley.blog/wp-content/uploads/2022/11/raw-unparsed-daily-esrl-mlo-1973-to-2020-2.xlsx
  4. Bromley, B., & Tamarkin, T. (2022). Correcting misinformation on atmospheric carbon dioxide. https://budbromley.blog/2022/05/20/correcting-misinformation-on-atmospheric-carbon-dioxide/

#ClimateChange #IPCC #GlobalWarming #ClimateCrisis #Sustainability #NetZero #EPA #EndangermentFinding #CO2 #ClimatePolicy #EnergyPolicy #FossilFuel #Henry’sLaw
Posted in Uncategorized | 12 Comments

CDIAC, Friedlingstein et al and the CO2 mistake

It seems the ICSL and other groups are sold on the papers and conclusions of Friedlingstein et al, aka CDIAC, which is about 50 authors, and their 16 annual reports on global carbon budget.  But facts and evidence do not support the elaborate and overly complex models and assumptions in Friedlingstein et al. 

For example, Friedlingstein et al, assume that only about 50% of human emissions are absorbed by the environment.  Why? How?  This assumption is apparently based on their complex estimates of human CO2 emissions and slope of human CO2 emissions in a well-hidden correlation with the net global average atmospheric CO2 concentration reported by NOAA/Scripps Mauna Loa.  First, this is an apples and oranges comparison.  Second, facts, experimental data and statistical analysis do not support that correlation.  And, even if that correlation were supported by evidence, as we all know and frequently ignore, correlations do not prove a cause-and-effect relationship exists. It is essentially a “plug” to make the numbers come out as they wish.  Friedlingstein et al and their followers assert the so-call “airborne fraction” argument. 

Professor of statistics Jamal Munshi and others have shown that the assumed correlation is spurious.  Professor Munshi explains the problems with the “airborne fraction” argument:” there is a mass balance problem with the causation hypothesis that fossil fuel emissions cause atmospheric CO2 concentration to rise. The mass balance shows that the assumed equality of annual fossil fuel emissions and annual rise in atmospheric CO2 is not found in the data. What we find instead is that annual emissions tend to be greater than the annual emissions needed to explain the observed annual change in atmospheric CO2. The explanation for this paradox offered by climate science is that the excess emissions are somehow removed from the atmosphere by carbon cycle flows so that not all the emissions end up in the atmosphere but no mechanism and no empirical evidence for this removal are offered. The portion of annual emissions used to explain the annual change in atmospheric CO2 concentration is called the “Airborne Fraction“.  

That the excess annual emissions not explained by annual change in atmospheric CO2 must therefore go somewhere else and if we look through the large carbon cycle flows maybe we can find a way to explain this paradox with the possibility but not the evidence that the missing CO2 goes into carbon cycle flows is a case of circular reasoning and confirmation bias. These data are interpreted as evidence that about half of the annual emissions stays in the atmosphere {The Airborne Fraction}and causes atmospheric CO2 to rise {to cause warming} and that the other half must therefore be absorbed by nature’s carbon cycle flows to one or more of the sinks in the carbon cycle system.

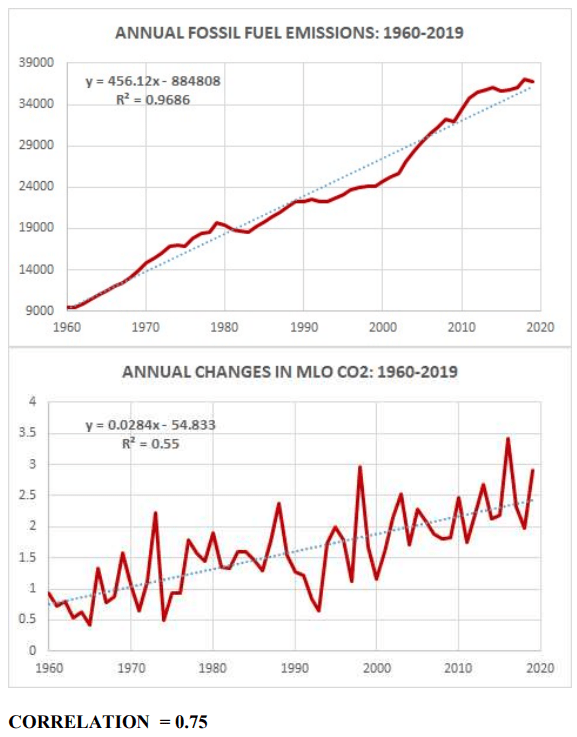
Friedlingstein et al, IPCC and followers of the human-CO2-caused climate agenda look at the following two graphs and conclude that there is a correlation between fossil fuel emissions and net global atmospheric CO2 concentration. Yes, there is a strong correlation. But they have not done the statistics properly.

Munshi, J. (attached)


Some of those people look at the two graphs above and notice that the two trends are diverging, and calculated fossil fuel CO2 emissions are growing faster than necessary to explain the trend in net CO2 concentration. The gap between the two trends they call the “Airborne Fraction”. If you struggle through reading Friedlingstein et al, you will see that the Airborne Fraction is obfuscation and fudge factors, and uncertainties are not resolved.

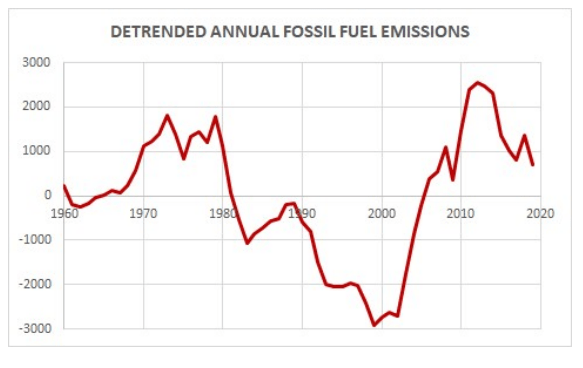
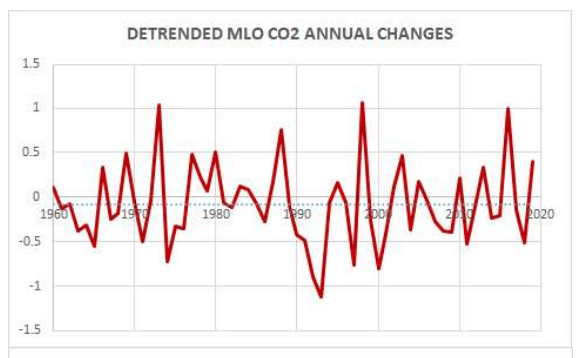
If instead you do proper statistics with these two data sets as is done here by Dr. Jamal Munshi, then you detrend these two data sets to removed the shared time-line and then re-run the correlation statistics.

Munshi, J. (attached)
Munshi, J. (attached.)

The correlation disappears when the two data sets are detrended. The apparent correlation was due to the time-line shared between the two data sets.

CIRCULAR REASONING AND CONFIRMATION BIAS: The problem is that this airborne fraction explanation of the emissions mass balance anomaly is a case of circular reasoning and confirmation bias as follows. The airborne fraction was not independently determined from theory but found in the data. A hypothesis was then derived from the data that the excess emissions not explained by the change in atmospheric CO2 are removed by the carbon cycle. This hypothesis was then tested with the same data used to construct the hypothesis. This kind of hypothesis test contains the circular reasoning fallacy. A hypothesis derived from the data cannot be tested with the same data.” (Munshi, attached.)

Bromley and Tamarkin (2022) and my addendum (attached) with a more conservative calculation show that Earth’s environment demonstrated the capacity to remove in 2 years more than 25 times the total of all CO2 from all sources which had been added to the atmosphere since daily measurements began reporting at Mauna Loa in May 1974 through June 15, 1991.  The net CO2 addition from all sources as of June 15, 1991 was 194 Gt CO2.  That is more than 5 times the amount of CO2 emissions (37.4 Gt CO2 estimated emissions only, not net emissions) estimated by Friedlingstein et al to have been added to the atmosphere by humans in 2020.

Friedlingstein et al assume the fossil fuels emissions data, cement emissions data, etc to be fact, when in fact they are only estimates.  In this context, they are not fact, because they do not know how much of those emissions are absorbed; could be less than 1% absorbed or could be 100% absorbed.  They use the estimates of fossil fuel emissions in the calculation to attempt to explain the “Airborne Fraction”. The result is more uncertainty. The Mauna Loa data is the net residual difference between two fluxes that are each much larger and with much large variations than the residual difference which is the net global average CO2 concentration which MLO reports.  Friedlingstein et al attempt to use a tiny fraction (i.e. estimated fossil fuel emissions) of a fraction (i.e. the annual increase in the residual difference) of two CO2 fluxes to explain the much larger variations in the residual net global average CO2 concentration measured at Mauna Loa. It should be no surprise that there is no correlation.

Where is the evidence that human emissions are NOT entirely absorbed?  Evidence does not support an assumption that the environment would treat human emissions differently than other CO2 emissions and absorptions. In view of the very high solubility of CO2 in ocean water, the relatively high 40:1 to 50:1 ratio of dissolved inorganic carbon in ocean water versus CO2 gas in air, the giant carbonate cliffs, caves, and mines of calcite, limestone, etc found around the world, thus the assumption that CO2 emitted is not also absorbed is non sequitur and specious.  And that non sequitur is now more obvious after Bromley & Tamarkin (2022). 

I have started a paper which is a critique and rebuttal to Friedlingstein et al.  Yes, there are more substantive arguments.  Friedlingstein et al. have enormous resources and I have none.  Plus, they have 16 years-worth of their annual carbon budget reports that need review.  Their models are excessively complex and loaded with assumptions and estimates, but this complexity is not necessary to the problem at hand. Volunteers welcome.

#ClimateChange #IPCC #GlobalWarming #ClimateCrisis #Sustainability #NetZero #EPA #EndangermentFinding #CO2 #ClimatePolicy #EnergyPolicy #FossilFuel #Henry’sLaw
References:

Friedlingstein et al.  https://essd.copernicus.org/preprints/essd-2021-386/essd-2021-386.pdf

Bromley, B., & Tamarkin, T., 2022. Correcting Misinformation on Atmospheric Carbon Dioxide; Pinatubo Study Phase 1 Report.  ClimateCite.org. https://pinatubostudy.com/pinatuboreport.html

The Specific Impulse Calculation. Short video explanation:  https://youtu.be/ph48Xwj_eS8

Professor Jamal Munshi explains the circular logic problem.

Posted in Uncategorized | 2 Comments

SCOTUS rules against EPA’s assumed authority on “greenhouse gas”

A very important opinion from SCOTUS today.

The U.S. Supreme Court, June 30, 2022, in a 6-3 decision in West Virginia v. EPA denied the EPA’s authority to enact sweeping regulations for greenhouse gases that would “decarbonize” American energy under the Clean Air Act. 

#ClimateChange #IPCC #GlobalWarming #ClimateCrisis #Sustainability #NetZero #EPA #EndangermentFinding #CO2 #ClimatePolicy #EnergyPolicy #FossilFuel #Henry’sLaw

Posted in Uncategorized | Leave a comment

Could not make this up

From the “you could not make this up if you tried” department…

Posted in Uncategorized | 2 Comments

“Triple vaxxed are the most likely to die from Covid-19.”

A testimony by a medical doctor in the very short video at the twitter link above,
Posted in Uncategorized | Leave a comment

About those chalk white cliffs

The English Channel and the coast of Sussex England

We should not rely on estimates of human CO2 from fossil fuels to calculate atmospheric CO2.  These data can only be used for the very broadest estimate of trend direction.  This is not meant as a critique of the long and diligent curation of these fossil fuel numbers by the U.S. Oak Ridge National Laboratory, nor critique of the works of Friedlingstein et al.  These curators must work with the data they are given.  Over the years many of the countries submitting fossil fuel data have been unreliable for many different reasons, for example Nigeria, Soviet Union, Iran, Venezuela, OPEC just to mention of a few of the largest suppliers.  As I write this, Israel is supplying natural gas to Egypt, which uses some and supplies it to Syria, which supplies it to Lebanon which is now supplying a large percentage of natural gas to the EU.  Then there is the 4 to 6 quarts of oil that has been in every car and truck and many industrial machines on the planet for the last 100 years, most of which is never burned.  At least, Friedlingstein et al attempt to estimate bunker fuels which can be stored for long periods.

If we look at the graphical data from the link thankfully supplied by A. Huijser and Nullschool.net,  

Link

this surface CO2 information is based in a very elaborate GEOS-5 model by NASA Goddard center.  This model is not from a right wing think tank or climate skeptics.  These are some of the strongest proponents of AGW.  Yet, what we see in these data is that in most cases the highest concentrations of CO2 at the surface are found where population is low and fossil fuel use is lowest.  And these areas of higher concentration make up more than 80% of the Earth’s surface area. Most of that area is over water and ice.   This strongly suggests that humans and fossil fuels are not increasing CO2 concentration.

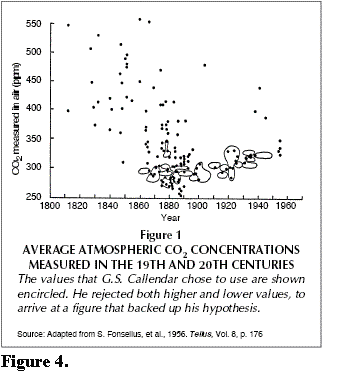
Secondly, we should not rely on estimates and assumptions that pre-industrial atmospheric CO2 concentration was stable around 290 ppm.  Measurements of CO2 in ice have been shown to have unacceptably high error rates (https://www.sciencedirect.com/science/article/pii/S0304420318300574be ) and for years now Professor Murry Salby has pointed out the error in ice core proxy data.  Mr. G.S. Callendar, who calculated the early assumptions of CO2 trend, has been shown to have “cherry-picked” his data points to fit his AGW theory. 

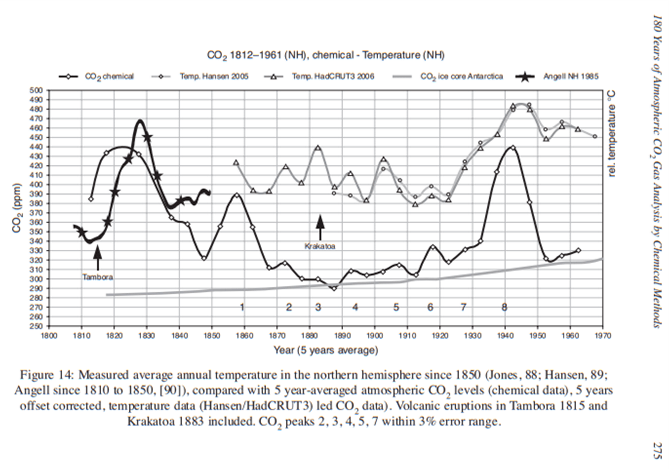
And the compilation by Ernst George Beck of the thousands of honest, independent measurements of CO2 concentrations does not support the theory of a stable CO2 trend.  Beck’s work is apparently ignored by IPCC et al. 

In other words, statements such as the currently in vogue “50% increase in CO2 due to human emissions” are not based on reliable data and should be discarded.   

Is it a coincidence that the highest surface CO2 concentration in Europe follows the Rhine river, the highest volume of river water flow in Europe, north to the lowlands, wetlands, rivers and marshes of Netherlands and Belgium and then across the English Channel there are 100 meter high white cliffs of Dover, the white cliff Seven Sisters of Sussex (photo at the top of this post), and down the coast of English Channel on the continent side are the chalk cliffs of Normandy, France?  Not likely to be a coincidence.  The Rhine is loaded with decaying biological runoff, saturated with CO2.  CO2 is highly soluble in cold water and calcium carbonate (calcite) is more soluble in cold water.  The cold Rhine and its estuary system has been carrying high concentrations of dissolved organic and inorganic carbonates for millions of years.   It reaches the large surface area of insolated, relatively warmer English Channel and calcite precipitates.  It should be needless to say that those carbonate rocks did not come from human produced CO2.  However, most of that rock was CO2 that was once in the atmosphere.  In fact, humans have been burning carbonate rock for about 12,000 years to make cement, and in that process releasing CO2 back into the air; yet we still have white carbonate cliffs, mines, and caves around the planet. 

The oceanic and atmospheric chemistry and physics that produced these huge carbonate deposits around the earth have not stopped.  The graphic data at the link provided by A. Huijser and Nullschool illustrates part of that chemistry and physics in operation today.  An easy-to-understand review of the carbonate chemistry is provided here by the University of Houston. https://uh.edu/~jbutler/kunming/carbonates.html

It is beyond absurd and irresponsible for people to be penalized by governments for emitting CO2 when the ocean, the arctic and the Antarctic which comprise over 80% of earth’s surface are emitting higher concentration of CO2 than heavily populated areas.  The conclusion must be that the penalty is not about the environment, nor about CO2.  The penalty is about politics, money and ideology.  The historical track record of humans following ideologies is millions of dead humans.

#ClimateChange #IPCC #GlobalWarming #ClimateCrisis #Sustainability #NetZero #EPA #EndangermentFinding #CO2 #ClimatePolicy #EnergyPolicy #FossilFuel #Henry’sLaw
Posted in Uncategorized | 9 Comments

Data refuting human-caused global warming theory

Setting the link below to view CO2 and surface, one would have to willfully ignore that CO2 measured in ppmv by satellite is higher concentration and coming from the ocean, water and unpopulated areas like the Arctic. It is not coming from heavily populated locations with humans and fossil fuel burning. 

Keep this site for future reference.

It refutes the AGW theory that human-caused CO2 is causing global warming.

You can put your cursor over Los Angeles, and CO2 measures 409 ppmv.  (Brown in the low end of the scale.)

Then put your cursor over the central pacific and it’s 428 ppmv. 

And over the Arctic it’s 434 ppmv.

Over the Antarctic it’s 425 ppmv.

At 6 minutes to midnight in Europe 24 June 2022, there is a band of 452 ppmv going north up the Rhine river out to the North Sea and English Channel by the low country around Rotterdam to Bruge, And there is a 452 ppmv CO2 band in central England flowing out River Severn from Gloucester England to Bristol Channel.  The highest CO2 concentration in the air at the surface is following the highest volume water flow rivers in Europe, not the population centers.

Look at New York City, Tokyo and heavily populated coastal cities near ocean.  The CO2 is coming from the ocean, not from these cities.

Link here

https://earth.nullschool.net/#2022/06/23/0300Z/chem/surface/level/overlay=co2sc/orthographic=-118.51,39.89,3000/loc=-126.039,40.144

“The GEOS data used in this study/project have been provided by the Global Modeling and Assimilation Office (GMAO) at NASA Goddard Space Flight Center.”

“The GEOS data used in this study/project have been provided by the Global Modeling and Assimilation Office (GMAO) at NASA Goddard Space Flight Center through the online data portal in the NASA Center for Climate Simulation”.

#ClimateChange #IPCC #GlobalWarming #ClimateCrisis #Sustainability #NetZero #EPA #EndangermentFinding #CO2 #ClimatePolicy #EnergyPolicy #FossilFuel #Henry’sLaw
Posted in Uncategorized | 6 Comments

Would this qualify as suicide or murder? 

Our political “representatives”, and I use that term very loosely, would be expecting us to pay for this project and “we” supposedly elected them.  If this or anything like it happens, such as artificial sun-blocking clouds, then there will be no one left to write it off to best intentions.   

A team of researchers at the Massachusetts Institute of Technology believe that we can mitigate the worst of climate change with… space bubbles. They’ve outlined a strategy in which a huge raft of bubbles, carefully positioned between Earth and the Sun, would deflect sunlight (and thus heat) to stop further global warming.

“Geoengineering might be our final and only option. Yet, most geoengineering proposals are earth-bound, which poses tremendous risks to our living ecosystem,” a web page dedicated to the solution reads. “If we deflect 1.8 percent of incident solar radiation before it hits our planet, we could fully reverse today’s global warming.”

The bubble array would be made of inflatable shields of thin silicon or another suitable material, according to the team. Thebubble cluster would be placed in outer space at a Lagrange Point, where the Sun’s and Earth’s gravitational pulls create a stable orbit. The researchers also said that if the plan becomes a reality in the future, the completed array would be roughly the size of Brazil.

They admitted that one of the main concerns with their proposal would be the logistics of fabricating a large film, transporting it into space, and then unfolding it to form the bubble raft. They suggested fabricating the spheres in outer space to minimize shipping costs.

“[The] bubbles can be intentionally destroyed by breaking their surface equilibrium, this would make the solar geoengineering solution fully reversible and significantly reduce space debris,” the MIT researchers wrote in a statement.

They also pointed to the difficulties of maintaining the integrity of the bubble shield. “Effective replenishment rate will be studied to ensure the shield maintains its size, together with strategies to guarantee a smooth end-of-life transition.”

This isn’t the first space-based solution proposed to block the Sun in some way. In 2017, a study suggested an Earth-sized shield to stop solar flares from messing with our communication systems.

But why go to such extremes (which surely have unforeseen risks and consequences)? The MIT researchers described the proposed space bubbles as something to supplement other climate change mitigation efforts, but it is still a speculative plan, and other solutions currently exist.

If the political will, funding, and technology is available for these high-tech solutions, the same should be possible for much more reasonable solutions, like putting a stop new oil and gas drilling projects.

According to the Intergovernmental Panel on Climate Change, we only have a a jarring three-year deadline to curb our emissions and stop climate disaster. Our current fossil fuel infrastructure is enough to push us over that edge, and we can prevent that by keeping the oil in the ground and working to decarbonize our systems.

People in the U.S. are already suffering the consequences of years of emissions. Some of the largest water reservoirs on the West Coast and in the Southwest are drying up. Several states are experiencing a dangerous heatwave right now, and cities all over the country are implementing water restrictions due to widespread drought.

We don’t exactly have the time to tinker around in space, hope that it works, and then continue to pump greenhouse gases into the atmosphere.

Enough with the fear and climate BS. Vote your politicians out of office. No doubt they funded the study or similar study in your neck of the woods.

What could go wrong? The next ice ball planet earth in the next, great ice age accompanied by extinction of all life on Earth except a few deep sea creatures. All thanks to the actions of “scientists” such as these and those who fund them or do nothing to stop them.

The so-called “scientists” apparently neglected to read the study showing 16% to 19% error in CO2 measurements from sub-zero degree C ice, as in arctic and Greenland ice core drillings, an error larger than all human CO2 emissions. They base their estimates, theories and climate models on these bubbles-in-ice measurements and assume CO2 concentration was stable around 290 ppm in the pre-industrial world, even though that claim contradicts their tree ring and similar proxy studies. (Trees and plants do not grow so well in low CO2 concentrations.)

What about the well-know Little Ice Age (16th to the 19th centuries), ya know, when George Washington crossed the Delaware river to surprise the British troops sent by King George to force the revolutionary colonists to pay his tax on tea, and carnivals were held on the frozen Thames through London and the canals of Holland? Do these “scientists” imagine that CO2 concentration was NOT increasing dramatically as the planet dramatically warmed after that Little Ice Age,? Well, unfortunately, they do. They tell us that CO2 concentration has increased 50% since those pre-industrial Little Ice Age days, but they neglect to mention that most of the CO2 increase occurred in the rapid warming that immediately followed the Little Ice Age, more than 100 years before SUV’s.

Net zero caveat emptor. Time to remove our so-called green politicians. All of them.

Posted in Uncategorized | 10 Comments

On the frontline with the Right Sector militia

I spent a week with a Ukrainian nationalist unit

BY ARIS ROUSSINOS June 18, 2022

Aris Roussinos is UnHerd’s Foreign Affairs Editor, and a former war reporter.arisroussinos


https://unherd.com/2022/06/on-the-frontline-with-the-right-sector-militia/?tl_inbound=1&tl_groups[0]=18743&tl_period_type=3&mc_cid=5be0fce2b9

or link here

On the frontline…

Inside the battle on the Eastern Front

I was given access to a secret Ukrainian base

BY DAVID PATRIKARAKOS

https://unherd.com/2022/06/inside-the-battle-on-the-eastern-front/?=refinnar

or link here

Inside the battle…

Posted in Uncategorized | 2 Comments

Guns

Jeff Snyder said it well in The Washington Times:

“But to ban guns because criminals use them is to tell the innocent and law-abiding that their rights and liberties depend not on their own conduct, but on the conduct of the guilty and the lawless, and that the law will permit them to have only such rights and liberties as the lawless will allow.”

I include the U.S. federal government bureaucracy, and especially the FBI, NSA, CIA, etc., DOJ, FDA, CDC, EPA and their equivalents in some states in the category of lawless. And it is a shameful fact.

The January 6 witch hunt being held in the U.S. Congress is an example of lawlessness, following the terrible, now infamous tradition of Democrats in two failed, lawless impeachment trials. Like those impeachment witch hunts, the Representatives, Senators, prosecutors and witnesses should be on trial and American voters know that. Meanwhile the deep state criminals who produced and enabled the fake evidence walk free. Justice has been turned upside down.

Instead of prosecuting the perpetrators of the obvious and now proven 2020 vote fraud, a committee of the U.S. Congress is producing propaganda at taxpayer expense against some of the people who, within their rights, protested the 2020 vote fraud, meanwhile some of those protestors are still jailed political prisoners without due process of law without a chance of a fair trial in Washington, D.C.

Meanwhile, that witch hunt committee of Congress and politicized federal so-called “investigation and justice” agencies ignore and hide instigators, including FBI and other clandestine operators, as well as organized perpetrators of violence who were bused in undercover and embedded with righteous protestors. Not a word about the 4 capitol police officers that day who later committed suicide, or testimony by the police officer who spoke to the young woman military veteran only seconds before she was point-blank murdered inside the capitol building, or the refusal by both Speaker Nancy Pelosi’s and Senate Majority Leader Chuck Schumer’s two sergeants at arms to accept National Guard troops previously approved by President Trump for that day. January 6 was an obvious false flag attack by the same people who instigated and perpetrated the fake impeachment and the summer of George Floyd violence prior to the 2020 election. It is all part of their insurance policy against a second Trump administration.

And not a word about the 50 top federal intelligence and security agency bureaucrats who publicly stated only days prior to the 2020 election that the Hunter Biden laptop story was fake, all with security clearance to know that the laptop was real and would influence the result in 2020 election. They are all part of the insurance policy.

Government today is a dirty business. It is past time for voters to vote them out.

Ron Clutz over on his blog Science Matters provides excellent commentary on this same subject.

2000 Mules is the Smoking Gun

by Ron Clutz

Jan. 6 Committee Ignores Clear Evidence Of Mass Illegal Voting, Systematically Broken Election Laws

BY: MARGOT CLEVELAND

JUNE 17, 2022

The Jan. 6 Committee completely sidestepped the verifiable evidence of systemic violations of election law, illegal voting, and more. Link here.

Author Margot Cleveland profile

VISIT ON TWITTER@PROFMJCLEVELAND

EXCLUSIVE: Police Report Proves Plainclothes Electronic Surveillance Unit Members Were Embedded Among Jan. 6 Protesters

Embedded ESU members wore a specific ‘bracelet on their left wrist identifying them as MPD personnel’

By Patricia Tolson

June 20, 2022 Updated: June 21, 2022

Link here.

Posted in Uncategorized | 4 Comments