
Richard Feynman frequently reminded us, “If it disagrees with experiment it is wrong. In that simple statement is the key to science. It does not make any difference how beautiful your guess is. It does not make any difference how smart you are, who made the guess, or what his name is – if it disagrees with experiment it is wrong. That is all there is to it.” (Feynman, 1965)
In the 2 years following the June 15, 1991 eruption of the Pinatubo volcano, the natural environment removed more CO2 than the entire increase in CO2 concentration due to all sources, human and natural, during the entire measured daily record of the Global Monitoring Laboratory of NOAA/Scripps Oceanographic Institute (MLO) May 17, 1974 to June 15, 1991. Then, in the 2 years after that, that CO2 was replaced plus an additional increment of CO2.
The Pinatubo Phase I Study (Bromley & Tamarkin, 2022) calculated the mass of net CO2 removed from the atmosphere based on measurements taken by MLO and from those measurements then calculated the first and second time derivatives (i.e., slope and acceleration) of CO2 concentration. We then demonstrated a novel use of the Specific Impulse calculation, a standard physical calculation used daily in life and death decisions. There are no theories, estimates or computer models involved in these calculations. The following calculation is a more conservative demonstration which makes it obvious that human CO2 is not increasing global CO2 concentration.
The average slope of the CO2 concentration in the pre-Pinatubo period in MLO data was 1.463 ppm/year based on the method described in Bromley and Tamarkin (2022). Slope is the rate of change of the CO2 concentration. The rate of change and slope of a CO2 concentration with respect to time elapsed are identical to the commonly known terms velocity and speed.
Converting ppm to mass of CO2. According to MLO, the CO2 concentration in the atmosphere on June 15, 1991 was 358 ppm. 1 ppm CO2 in air = 7.76 GtCO2. Thus 358 ppm * 7.76 GtCO2 = 2778 Gt CO2 in air on June 15, 1991. The mass of CO2 in the atmosphere on June 15, 1991 per MLO was 2778 GtCO2. This is the measured mass of all CO2 in the atmosphere, there is no human residual.
(Note this is not GtC, i.e., gigatonnes of carbon. GtC and GtCO2 are not equivalent. This is GtCO2,, i.e., gigatonnes of CO2. MLO measures micromoles CO2 per mole of dry air, which is ppm, not ppmv. Ppm and ppmv are not equivalent. )
For avoidance of doubt about the method described in Bromley and Tamarkin (2022), here I compare slope (i.e., velocity), which is calculated using only published MLO data. to slope (i.e., velocity) calculated in Bromley & Tamarkin (2021):
MLO began reporting daily CO2 data on May 17, 1974 and on that day reported 333 ppm. Not including May 17, there were 6238 days between May 17, 1974 and June 15, 1991.
- MLO velocity = (358 – 333 ppm)/6238 days = 0.004008 ppm per day
- Bromley & Tamarkin velocity = 1.463 ppm per year / 365 days = 0.004008 ppm per day
On June 15, 1991, the velocity of 2778 Gt CO2 = 1.463 ppm per year * 7.76 GtCO2 per ppm = 11.35 GtCO2 per year. Then 11.35 GtCO2 per year divided by 365 days per year = 0.03 GtCO2 per day. On June 15, 1991 net global average atmospheric CO2 velocity was 0.03 GtCO2 per day. This is the MLO-measured daily rate of change of total atmospheric CO2 concentration from all sources on June 15, 1991.
On April 22, 1993, GtCO2 velocity was 0.62 ppm per year. Then 0.62 * 7.76 GtCO2 per ppm = 4.81 GtCO2 divided by 365 days = 0.0132 GtCO2 per day. On April 23, 1993 net global average atmospheric CO2 velocity was 0.0132 GtCO2 per day. This is the MLO-measured daily rate of change of total atmospheric CO2 concentration from all sources on April 22, 1993. As of On April 22, 1993, CO2 concentration had decelerated rapidly after Pinatubo, since June 15, 1991. CO2 velocity continued to decline after April 22, 1993.
June 15, 1991 was the start of the major Pinatubo volcanic eruption and April 22, 1993 was the date of maximum deceleration in net global average atmospheric CO2 concentration after Pinatubo, as reported in the daily measurement record of MLO.
Elapsed time t = 677 days from June 15, 1991 to April 22, 1993 (not including April 22.)
Initial velocity u = 0.03 GtCO2 per day
Final velocity v = 0.01 GtCO2 per day
Acceleration a = (v-u)/t
a = (0.01 – 0.03)/677 days
a = -2.95 * 10-5 GtCO2 per day per day
The net force F on a mass equals the mass times the acceleration of the mass. (Newton’s 2nd law of motion. F = ma)
As shown above, the net mass of CO2 in the atmosphere on June 15, 1991 per MLO was 2778 GtCO2.
F = 2778 GtCO2 * – 2.95 * 10-5GtCO2 per day per day = – 0.082 Newtons
F = the breaking power or force the environment exerted on the net CO2 mass in the air in response to the surface cooling that followed the Pinatubo eruption. CO2 molecular motion was slowed. The negative sign indicates the vector direction of the force, i.e., CO2 was decelerating, cooling. CO2 was being removed from the atmosphere as it collided with surfaces, dominantly ocean surface, by its relatively increased absorbance in cooler water surface, following Henry’s Law.
Impulse J = Force * elapsed time, which may be written J = Ft
Jn = – 0.082 Newtons * 677 days = – 55.5 Newton seconds is the standard unit for specific impulse.
The impulse calculation tells us whether a car has enough braking force to stop before hitting the wall, or enough force to take the rocket into orbit before it runs out of fuel, or, as in the analogy in the Phase Pinatubo report (Bromley & Tamarkin, 2022), enough force to accelerate the loaded 747 to liftoff velocity before reaching the end of the runway, or enough force to overcome addition of human CO2 to air.
The above calculation for Jn is for the total mass of net global CO2 in the atmosphere. Next, we want to compare that Jn to the Jh for the human-produced CO2 component. But, unfortunately we only have estimates based on theoretical assumptions and dubious sources for the human CO2 component. Therefore, instead of using these theories, assumptions and estimates, we will now calculate an amount of CO2 that by definition must be larger and is in fact clearly larger than the human CO2 component. That is, we calculate a hypothetical not-to-exceed amount of human-CO2 . For avoidance of doubt, this not-to-exceed amount will be more conservative than previously demonstrated in Bromley and Tamarkin (2022).
MLO began reporting daily CO2 data on May 17, 1974. On that day, MLO reported 333.38 ppm. On June 15, 1991, MLO reported 358 ppm. 358 minus 333 = 25 ppm increase in total CO2. This increase includes all CO2 in the atmosphere from all sources, human and natural, during the 677-day period May 17, 1974 to June 15, 1991.
25 ppm * 7.76 GtCO2 per ppm = 194 GtCO2 increase in CO2 during the stated period.
For this comparison, attribute that entire increase in MLO CO2 since May 17, 1974 when the daily record began to humans. This amount was measured by MLO and we know this amount exceeds the actual net human CO2 component added to the atmosphere since it includes net CO2 increases from all sources and sinks, human and natural.
The average velocity for the pre-Pinatubo period in the MLO data set is 1.463 ppm per year, as calculated above. Converting that amount to GtCO2 we have velocity = 1.463 * 7.76 GtCO2 per ppm = 11.35 GtCO2 per year. Thus, for this hypothetical comparison, net velocity of CO2 concentration due to humans cannot exceed 11.35 GtCO2 per year.
11.35 GtCO2 per year divided by 365 days per year = 0.031 Gt “human” CO2 added per day. Assume that human CO2 emissions continued unabated, i.e., human CO2 emissions did not slow following Pinatubo, even though total CO2 as reported by MLO was decelerating precipitously. This assumption makes the following calculation extremely conservative.
Thus:
Hypothetical “human” CO2 mass m = 0.031 Gt “human” CO2 per day * 677 days = 21.05 Gt “human” CO2 added post Pinatubo.
Adding: 194 GtCO2 increase from all sources during the stated, MLO-measured pre-Pinatubo period + 21.05 GtCO2 “human” added post Pinatubo = 215 GtCO2.
Thus, hypothetical “Human” emissions cannot exceed 215 GtCO2.
Then hypothetical not-to-exceed “human” CO2 mass, m = 215 GtCO2
On June 15, 1991, the velocity u of 215 GtCO2 = 1.463 ppm per year * 7.76 GtCO2 per ppm
= 11.35 / 365 = 0.031 GtCO2 per day.
Hypothetically, on April 22, 1993, 677 days later, final velocity v of “human” CO2 was the same 0.031 GtCO2 per day. But to be extremely conservative in this comparison, let v = 0.041 GtCO2 per day. In other words, for this comparison, we let “human” CO2 grow faster than total CO2 was growing prior to the eruption even though on April 22, 1993 MLO-measured net CO2 concentration was declining sharply.
Thus, 0.041 – 0.031 = 0.01 GtCO2 per day. Thus post-Pinatubo acceleration a of ”human” CO2 = (v – u)/t =0.01/677 = 1.48 * 10-5 GtCO2 per day per day
F = ma (Newton’s 2nd law of motion. F = ma)
F = 215 GtCO2 * (1.48 X 10-5 GtCO2 per day per day) = 0.0032
“Human” CO2 specific impulse Jh = 0.0032 Newtons * 677 days = 2.17
Jh = 2.17 is the specific impulse for our hypothetical “human” CO2 emissions.
Comparison:
- 2.17 for hypothetical “human” CO2 emissions
- -55.5 for natural CO2 removal from atmosphere
- – 25.6 / 1 is the ratio. The minus sign indicates the vector direction indicating CO2 absorption. Removal of CO2 is over 25 times the maximum possible increase in CO2 by hypothetical “human” net emissions even when “human” is conservatively calculated to include all sources and sinks of CO2 in the MLO daily measurement record prior to the Pinatubo eruption.
In this conservative calculation, based entirely on MLO measurements (not theory, not models, and not estimates), Earth’s environment demonstrated the capacity to absorb more than 25 times the not-to-exceed amount of “human” CO2 emissions at that time. The units drop out of the comparative calculation to yield a dimensionless 25 times ratio. (The units for J and F are not precisely correct in this novel use of the specific impulse calculation which would usually include a distance. It is important to keep the units the same in the comparison, as is done here.)
During the global cooling event in the 2 years following the Pinatubo eruption, CO2 concentration decelerated rapidly. Following that 2 year period, in the next 2 years CO2 accelerated more rapidly than it had declined, reaching an average CO2 slope which exceeded MLO-measured slope for the period prior to the June 1991 Pinatubo eruption. The maximum force of the environment to both absorb and emit CO2 could be much larger than 25 times net “human” emission, and it and could occur much faster. We do not know the environment’s maximum possible force or maximum possible specific impulse But it is very safe to infer from this result that human CO2 emissions are not an environmental crisis.
If a reason exists that the natural environment responds to human CO2 in a significantly different way, e.g., the commonly asserted belief that the environment absorbs half of human CO2, then the reader is invited to put forth that theory. The calculations using MLO data presented here disprove that theory. The theory that net human CO2 is causing net global CO2 concentration is shown by this calculation to be implausible.
The questions shouting to be answered by AGW proponents: where did that CO2 go? And, where did the recovery CO2 come from?
We are working from experiment first, sometimes called first principles. We are looking for theory that explains our experimental result. We reject the opposite process which is unfortunately used at great detriment to science, life, societies, and economics. We are not looking for data to fit a priori theory, such as the IPCCs pre-conceived objective of human-caused global warming. We are looking for theory to explain our experimental result.
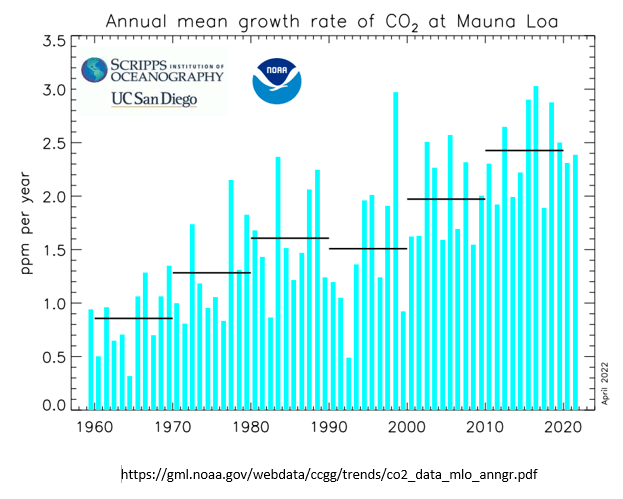
The data and graphs produced by MLO also show a reduction in slope of total CO2 concentration following the June 1991 eruption of Pinatubo, and also show the more rapid recovery of total CO2 concentration that began about 2 years after the 1991 eruption. This graph is the annual rate of change (i.e., velocity or slope) of total atmosphere CO2 concentration. This graph is not human CO2 emissions.
Theoretical discussion and conclusion
These are the experiment results. Theory must explain these results, not the other way around.
Bromley and Tamarkin (2022) suggested a theory how this very large amount of CO2 could be absorbed so rapidly into the environment, mostly ocean surface. This experimental result is consistent with Henry’s Law, the Law of Mass Action and Le Chatelier’s principle. In a forthcoming addendum to Bromley and Tamarkin (2022), two additional laws, Fick’s Law and Graham’s Law are suggested additions to our theory explaining this experimental result.
There are several inorganic chemical sources in the sea surface thin layer which produce CO2 through a series of linked reactions which are mediated by surface temperature. Based on theories asserted more than 60 years ago (Bolin, 1960), inorganic and organic chemical sources and sinks in ocean surface are believed to be too small and/or too slow to explain the slope of net global average CO2 concentration. These results and calculations disprove those theories. The erroneous calculation is discussed in more detail in another post. Our results strongly suggest that the net CO2 absorption and net
There are several inorganic chemical sources in the sea surface thin layer which produce CO2 through a series of linked reactions which are mediated by surface temperature. Based on theories asserted more than 60 years ago (Bolin, 1960), inorganic and organic chemical sources and sinks in ocean surface are believed to be too small and/or too slow to explain the slope of net global average CO2 concentration. These results and calculations disprove those theories. The erroneous calculation is discussed in more detail in another post. Our results strongly suggest that the net CO2 absorption and net CO2 emission events that followed the Pinatubo eruption are response and recovery to a perturbation to the ongoing natural trend controlled by Henry’s Law.
There is no suggestion in our results or in our theory on in this post that long-term warming of SST causes the slope of net global average CO2 concentration. Simply said, we have not looked at temperatures, nor at correlation statistics between temperature and CO2 concentration because they are co-dependent variables, and the simultaneity bias due to these two variables cannot be removed with acceptable certainty. References to 25 degrees C in Bromley and Tamarkin (2022) are only in theoretical discussion and not involved in any way in our data analysis or calculations. References to 25 degrees C are merely standard ambient temperature, part of SATP, agreed by standards organizations.
When CO2 slope and acceleration declined post-Pinatubo, why was there a recovery to previous slope? What causes the additional offset increase in slope? The decline and the recovery were certainly not due to humans nor to the biosphere. As we have shown here, CO2 specific impulse from humans and biosphere combined are over an order of magnitude less than the impulse of CO2 absorbed by the environment. That alone should end fears of CO2-caused climate crisis. Where did the CO2 go so rapidly? And, where did the CO2 in the recovery come from? Our data suggests that in future research we will find a series of other events, other volcanoes, El Ninos and La Ninas, etc. that have similarly disrupted the equilibrium followed by a response and recovery from the environment.
References
Bolin, Bert. 1960. On the Exchange of Carbon Dioxide between the Atmosphere and the Sea, Tellus, 12:3, 274-281, DOI: 10.3402/tellusa.v12i3.9402 To link to this article: https://doi.org/10.3402/tellusa.v12i3.9402
Bromley, B., & Tamarkin, T., 2022. Correcting Misinformation on Atmospheric Carbon Dioxide; Pinatubo Study Phase 1 Report. ClimateCite.org. https://pinatubostudy.com/pinatuboreport.html
The Specific Impulse Calculation: https://youtu.be/ph48Xwj_eS8
Thoning, K.W., Crotwell, A.M., & Mund, J.W. (2021). Atmospheric carbon dioxide dry air mole fractions from continuous measurements at Mauna Loa, Hawaii, Barrow, Alaska, American Samoa and South Pole. 1973-2020, Version 2021-08-09. National Oceanic and Atmospheric Administration (NOAA), Global Monitoring Laboratory (GML), Boulder, Colorado, USA https://doi.org/10.15138/yaf1-bk21 Data Set Name: co2_mlo_surface-insitu_1_ccgg_DailyData. Description: Atmospheric carbon dioxide dry air mole fractions from quasi-continuous measurements at Mauna Loa, Hawaii.
#ClimateChange #IPCC #GlobalWarming #ClimateCrisis #Sustainability #NetZero #EPA #EndangermentFinding #CO2 #ClimatePolicy #EnergyPolicy #FossilFuel #Henry’sLaw
CC BY-NC-ND 4.0 Bud Bromley. All rights reserved.

Pingback: How Henry’s Law controls CO2 | budbromley
Pingback: In Defence of Non-IPCC CO2 Science | Science Matters
Pingback: Postmoderne vitenskap versus klassisk vitenskap – Egils blogg
Pingback: By the Numbers: CO2 Mostly Natural | Science Matters
Pingback: CDIAC, Friedlingstein et al and the CO2 mistake | budbromley