
It seems the ICSL and other groups are sold on the papers and conclusions of Friedlingstein et al, aka CDIAC, which is about 50 authors, and their 16 annual reports on global carbon budget. But facts and evidence do not support the elaborate and overly complex models and assumptions in Friedlingstein et al.
For example, Friedlingstein et al, assume that only about 50% of human emissions are absorbed by the environment. Why? How? This assumption is apparently based on their complex estimates of human CO2 emissions and slope of human CO2 emissions in a well-hidden correlation with the net global average atmospheric CO2 concentration reported by NOAA/Scripps Mauna Loa. First, this is an apples and oranges comparison. Second, facts, experimental data and statistical analysis do not support that correlation. And, even if that correlation were supported by evidence, as we all know and frequently ignore, correlations do not prove a cause-and-effect relationship exists. It is essentially a “plug” to make the numbers come out as they wish. Friedlingstein et al and their followers assert the so-call “airborne fraction” argument.
Professor of statistics Jamal Munshi and others have shown that the assumed correlation is spurious. Professor Munshi explains the problems with the “airborne fraction” argument:” there is a mass balance problem with the causation hypothesis that fossil fuel emissions cause atmospheric CO2 concentration to rise. The mass balance shows that the assumed equality of annual fossil fuel emissions and annual rise in atmospheric CO2 is not found in the data. What we find instead is that annual emissions tend to be greater than the annual emissions needed to explain the observed annual change in atmospheric CO2. The explanation for this paradox offered by climate science is that the excess emissions are somehow removed from the atmosphere by carbon cycle flows so that not all the emissions end up in the atmosphere but no mechanism and no empirical evidence for this removal are offered. The portion of annual emissions used to explain the annual change in atmospheric CO2 concentration is called the “Airborne Fraction“.
That the excess annual emissions not explained by annual change in atmospheric CO2 must therefore go somewhere else and if we look through the large carbon cycle flows maybe we can find a way to explain this paradox with the possibility but not the evidence that the missing CO2 goes into carbon cycle flows is a case of circular reasoning and confirmation bias. These data are interpreted as evidence that about half of the annual emissions stays in the atmosphere {The Airborne Fraction}and causes atmospheric CO2 to rise {to cause warming} and that the other half must therefore be absorbed by nature’s carbon cycle flows to one or more of the sinks in the carbon cycle system.
Friedlingstein et al, IPCC and followers of the human-CO2-caused climate agenda look at the following two graphs and conclude that there is a correlation between fossil fuel emissions and net global atmospheric CO2 concentration. Yes, there is a strong correlation. But they have not done the statistics properly.
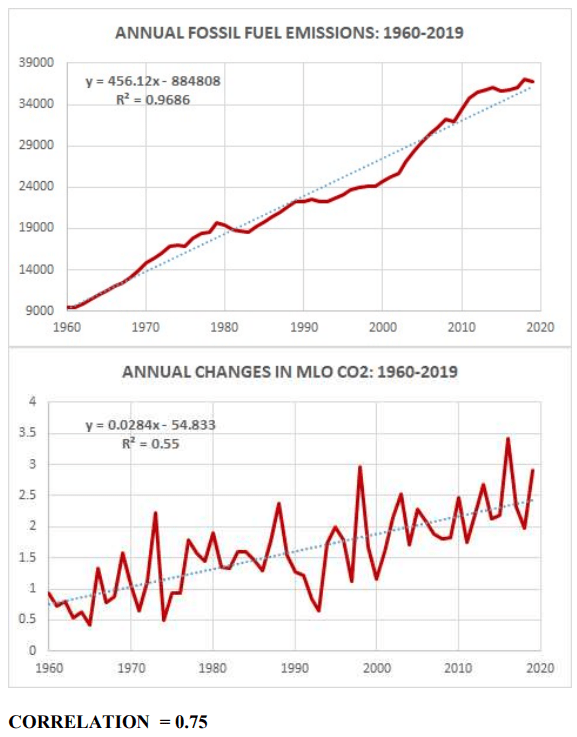
Some of those people look at the two graphs above and notice that the two trends are diverging, and calculated fossil fuel CO2 emissions are growing faster than necessary to explain the trend in net CO2 concentration. The gap between the two trends they call the “Airborne Fraction”. If you struggle through reading Friedlingstein et al, you will see that the Airborne Fraction is obfuscation and fudge factors, and uncertainties are not resolved.
If instead you do proper statistics with these two data sets as is done here by Dr. Jamal Munshi, then you detrend these two data sets to removed the shared time-line and then re-run the correlation statistics.
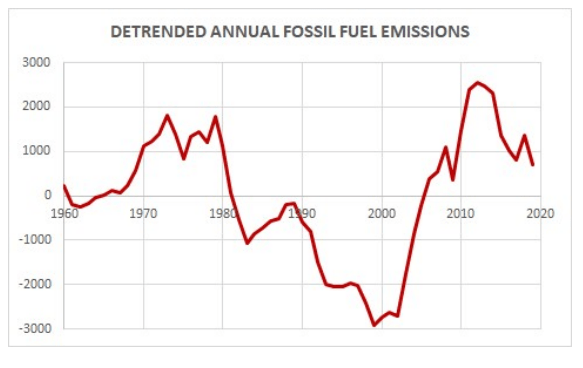
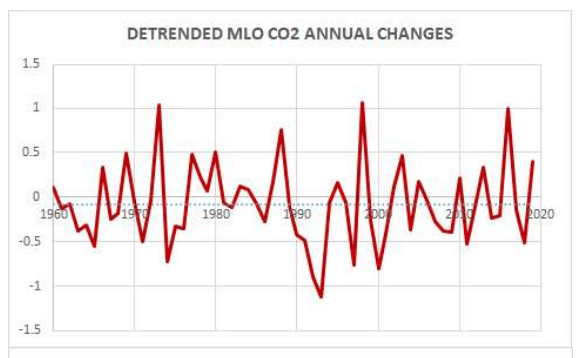
The correlation disappears when the two data sets are detrended. The apparent correlation was due to the time-line shared between the two data sets.
CIRCULAR REASONING AND CONFIRMATION BIAS: The problem is that this airborne fraction explanation of the emissions mass balance anomaly is a case of circular reasoning and confirmation bias as follows. The airborne fraction was not independently determined from theory but found in the data. A hypothesis was then derived from the data that the excess emissions not explained by the change in atmospheric CO2 are removed by the carbon cycle. This hypothesis was then tested with the same data used to construct the hypothesis. This kind of hypothesis test contains the circular reasoning fallacy. A hypothesis derived from the data cannot be tested with the same data.” (Munshi, attached.)
Bromley and Tamarkin (2022) and my addendum (attached) with a more conservative calculation show that Earth’s environment demonstrated the capacity to remove in 2 years more than 25 times the total of all CO2 from all sources which had been added to the atmosphere since daily measurements began reporting at Mauna Loa in May 1974 through June 15, 1991. The net CO2 addition from all sources as of June 15, 1991 was 194 Gt CO2. That is more than 5 times the amount of CO2 emissions (37.4 Gt CO2 estimated emissions only, not net emissions) estimated by Friedlingstein et al to have been added to the atmosphere by humans in 2020.
Friedlingstein et al assume the fossil fuels emissions data, cement emissions data, etc to be fact, when in fact they are only estimates. In this context, they are not fact, because they do not know how much of those emissions are absorbed; could be less than 1% absorbed or could be 100% absorbed. They use the estimates of fossil fuel emissions in the calculation to attempt to explain the “Airborne Fraction”. The result is more uncertainty. The Mauna Loa data is the net residual difference between two fluxes that are each much larger and with much large variations than the residual difference which is the net global average CO2 concentration which MLO reports. Friedlingstein et al attempt to use a tiny fraction (i.e. estimated fossil fuel emissions) of a fraction (i.e. the annual increase in the residual difference) of two CO2 fluxes to explain the much larger variations in the residual net global average CO2 concentration measured at Mauna Loa. It should be no surprise that there is no correlation.
Where is the evidence that human emissions are NOT entirely absorbed? Evidence does not support an assumption that the environment would treat human emissions differently than other CO2 emissions and absorptions. In view of the very high solubility of CO2 in ocean water, the relatively high 40:1 to 50:1 ratio of dissolved inorganic carbon in ocean water versus CO2 gas in air, the giant carbonate cliffs, caves, and mines of calcite, limestone, etc found around the world, thus the assumption that CO2 emitted is not also absorbed is non sequitur and specious. And that non sequitur is now more obvious after Bromley & Tamarkin (2022).
I have started a paper which is a critique and rebuttal to Friedlingstein et al. Yes, there are more substantive arguments. Friedlingstein et al. have enormous resources and I have none. Plus, they have 16 years-worth of their annual carbon budget reports that need review. Their models are excessively complex and loaded with assumptions and estimates, but this complexity is not necessary to the problem at hand. Volunteers welcome.
#ClimateChange #IPCC #GlobalWarming #ClimateCrisis #Sustainability #NetZero #EPA #EndangermentFinding #CO2 #ClimatePolicy #EnergyPolicy #FossilFuel #Henry’sLaw
References:
Friedlingstein et al. https://essd.copernicus.org/preprints/essd-2021-386/essd-2021-386.pdf
Bromley, B., & Tamarkin, T., 2022. Correcting Misinformation on Atmospheric Carbon Dioxide; Pinatubo Study Phase 1 Report. ClimateCite.org. https://pinatubostudy.com/pinatuboreport.html
The Specific Impulse Calculation. Short video explanation: https://youtu.be/ph48Xwj_eS8
Professor Jamal Munshi explains the circular logic problem.

Bud Getting this stupidity laid will be an uphill – but really important. Correlation ain’t causation but lack of correlation is a killer? See my graphs? Howard
Sent from my iPhone
>
LikeLike
“Friedlingstein et al, assume that only about 50% of human emissions are absorbed by the environment.”
Utter nonsense!
If the anthropogenic contribution is four per cent, then that is the concentration it will maintain throughout the cycle, this is very easy to calculate.
Essentially, it can be considered to be related to the ‘purge stream’ beloved of chemical engineers only in reverse., this is used to prevent the build-up of unwanted components in cyclic processes such as inert gases in the distillation of air by bleeding off a certain percentage of the flow.
Click to access lect12-recycle-bypass-purge.pdf
These people are completely stupid, do they believe the CO2 molecules have little labels if they are of anthropogenic origin so they can be recognised by the innumerable CO2 sinks and rejected?
I’d love to see how they would cope with an entropy-enthalpy diagram!
LikeLiked by 1 person