Correlation Analysis: CO2 Lags Temp! (a reblog)

Posted by: chaamjamal on: September 4, 2019

bandicam 2019-09-04 19-40-40-007

[HOME PAGE OF THIS SITE]

THIS POST IS A CRITICAL REVIEW OF A RESEARCH PAPER THAT SHOWS THAT THE EARTH’S SURFACE TEMPERATURE IS CORRELATED WITH LAGGED CO2 CONCENTRATION OF THE ATMOSPHERE. THE CITATION AND ABSTRACT OF THE PAPER APPEARS BELOW:  

Humlum, Ole, Kjell Stordahl, and Jan-Erik Solheim. “The phase relation between atmospheric carbon dioxide and global temperature.” Global and Planetary Change 100 (2013): 51-69. 

Abstract: Using data series on atmospheric carbon dioxide and global temperatures we investigate the phase relation (leads/lags) between these for the period January 1980 to December 2011. Ice cores show atmospheric CO2 variations to lag behind atmospheric temperature changes on a century to millennium scale, but modern temperature is expected to lag changes in atmospheric CO2, as the atmospheric temperature increase since about 1975 generally is assumed to be caused by the modern increase in CO2. In our analysis we use eight well-known datasets: 1) globally averaged well-mixed marine boundary layer CO2 data, 2) HadCRUT3 surface air temperature data, 3) GISS surface air temperature data, 4) NCDC surface air temperature data, 5) HadSST2 sea surface data, 6) UAH lower troposphere temperature data series, 7) CDIAC data on release of anthropogene CO2, and 8) GWP data on volcanic eruptions. Annual cycles are present in all datasets except 7) and 8), and to remove the influence of these we analyze 12-month averaged data. We find a high degree of co-variation between all data series except 7) and 8), but with changes in CO2 always lagging changes in temperature. The maximum positive correlation between CO2 and temperature is found for CO2 lagging 11–12 months in relation to global sea surface temperature, 9.5–10 months to global surface air temperature, and about 9 months to global lower troposphere temperature. The correlation between changes in ocean temperatures and atmospheric CO2 is high, but do not explain all observed changes. ► Changes in global atmospheric CO2 are lagging 11–12 months behind changes in global sea surface temperature. ► Changes in global atmospheric CO2 are lagging 9.5–10 months behind changes in global air surface temperature. ► Changes in global atmospheric CO2 are lagging about 9 months behind changes in global lower troposphere temperature. ► Changes in ocean temperatures explain a substantial part of the observed changes in atmospheric CO2 since January 1980. ► Changes in atmospheric CO2 are not tracking changes in human emissions.

FIGURE 1: 12-MONTH LAG SOURCE DATA CORRELATIONSSOURCE-12MONTH

FIGURE 2: 12-MONTH LAG DETRENDED CORRELATIONSDET-12MONTH

FIGURE 3: 9-MONTH LAG SOURCE DATA CORRELATIONSSOURCE-9MONTHS

FIGURE 4: 9-MONTH LAG DETRENDED CORRELATIONSDETRENDED-9MONTHS

  1. The correlations claimed by the authors of the paper are tested with UAH satellite data for monthly mean lower troposphere temperatures 1979 to 2018 against Mauna Loa monthly mean CO2 data 1977 to 2018. Twenty four regional temperatures are tested. They are labeled numerically in the charts above as 1 to 24. They are, in sequence from 1 to 24, Global, G land, G ocean, Northern Hemisphere, NH land, NH ocean, Southern Hemisphere, SH land, SH ocean, Tropics, T land, T ocean, Northern Extent, NE land, NE ocean, Southern Extent, SE land, SE ocean, North Polar, NP land, NP ocean, South Polar, SP land, SP ocean. Both 12-month and 9-month lags are tested.
  2. Correlation and detrended correlation between temperature and lagged CO2 are computed and the results are summarized in the charts above. Figure 1 and Figure 3 show correlations between the source data at 12-month and 9-month lags. At both lags we find a large range of correlations from negative values to very high correlations of max-ρ=[0.787,0.811] with medians of median-ρ=[0.695,0.658] for 12-month and 9-month lag respectively. These correlations are statistically significant and appear to support the authors claim of a lagged correlation between atmospheric CO2 and surface temperature indicating that temperature rises first and CO2 follows 9-12 months later and that therefore it is not possible for atmospheric CO2 to be the causal agent of the observed warming.
  3. However, as described in related posts, correlations between two time series where both series have long term trends, can be driven by the trends and not by responsiveness at any finite time scale less than the full span of the data [LINK] . Detrended correlation is used to remove the spurious shared trend effect so that responsiveness of atmospheric CO2 to temperature can be tested. These detrended correlations are shown in Figure 2 and Figure 4. The charts show near zero detrended correlations of median-ρ=[0.011,0.009] for 12-month and 9-month lag respectively. Virtually none of the source data correlation survives into the detrended series. This result implies that the correlations seen in the source data are spurious and that the relationship they imply is illusory. Their only information content is that both series have a rising trend. No responsiveness at an annual time scale is found.
  4. CONCLUSION: The lagged correlation between surface temperature and atmospheric carbon dioxide concentration reported by these authors is spurious. Therefore the apparent responsiveness of atmospheric CO2 to surface temperature is illusory. In the absence of such responsiveness it cannot be claimed that the data presented show a reverse relationship between temperature and atmospheric carbon dioxide such that temperature drives carbon dioxide and not the other way around. 

Original blog post: https://tambonthongchai.com/2019/09/04/correlation-analysis-co2-lags-temp/

Reference linked in the above article: Spurious Correlations in Climate Science

Posted by: chaamjamal on: May 27, 2018

  1. DETRENDED CORRELATION ANALYSIS OF TIME SERIES DATA: Correlation between  x and y in time series data derive from responsiveness of y to x at the time scale of interest and also from shared long term trends. These two effects can be separated by detrending both time series as explained by Alex Tolley in the video frame of Figure 3. When the trend effect is removed only the responsiveness of y to x remains. This is why detrended correlation is a better measure of responsiveness than source data correlation as explained very well by Alex Tolley in the video. The full video may be viewed on Youtube [LINK] . That spurious correlations can be found in time series data when detrended analysis is not used is demonstrated with examples at the Tyler Vigen Spurious Correlation website [LINK] . Spurious correlations are common in climate science where many critical relationships that support the fundamentals of anthropogenic global warming (AGW) are found to  be based on spurious correlations.

The reader is strongly encouraged to read the full articles including the examples in the links.

Posted in Uncategorized | 2 Comments

Depopulation

A 6 minute video by Zachary Denman

Above on YouTube

Above on Vimeo

NOT Sci-fi, the following video is a great interview of Celeste Solum (FEMA Employee) by Mike Adams from Brighteon. Be seated. Celeste tells us that the New World Order and Agenda 21 is set to finalize soon. She describes the WEF/UN globalist plan which is now over 250 layers thick. “The ultimate goal is depopulation.”

In the short video below, former Greenpeace President Dr. Patrick Moore of Canada says the elites have a ‘suicide pact’ to reduce the world’s population. Video excerpt below.

Posted in Uncategorized | 2 Comments

G20 Summit Declares “Let’s Have A Digital Health Certificate”

by John Colascione on 12/23/2022 1:34 pm.  The Published Reporter. (link below)


WASHINGTON, D.C. – In November, the Group of Twenty (G20) – an intergovernmental forum comprising 19 countries and the European Union – met in in Bali, Indonesia, and one development out of the summit was the upcoming adoption of a controversial color-coded health monitoring smartphone app meant to protect people from COVID-19. 


The app would be similar in nature to one already employed by China, which critics have argued has been used by the totalitarian regime in that country to control the movement of their population. The app in question displays color codes to denote their vaccination status and determine if its user has tested positive for COVID-19 or not.


One shocking video that has surfaced on Twitter showed that Chinese authorities had remotely switched the app’s health status for a large number of individuals traveling from the city of Guangzhou from green – indicating that the user is COVID-free – to yellow or red – indicating exposure or full-on infection – falsely forcing them to quarantine and preventing them from traveling home. 


Recently, reports have surfaced that the Chinese Communist Party has been changing the app’s color codes seemingly at random – often without legitimate proof of any infection – in order to limit the freedoms of their population as per the country’s ruthlessly authoritarian “Zero COVID” strategy. 


China 🇨🇳

The Chinese authorities have remotely switched these people’s Covid digital QR passport to yellow or red to stop them from leaving Guangzhou. They are now stuck in Guangzhou and unable to travel home.

Welcome to tech totalitarianism.pic.twitter.com/fJ32VY4fg4

— James Melville (@JamesMelville) December 2, 2022


In addition, there have been other reports of similar occurrences happening to other Chinese residents, illustrating that what happened in Guangzhou was far from an isolated incident. 


Since China adopted the use of the app, speculation as to its potential abuse has run rampant, and the topic of potentially adopting such tech by the rest of the world in order to serve as a COVID passport of sorts – where a “green” reading on the app would allow individuals to travel freely, whereas yellow or red would not – has some growing concerned. 


During November’s Business 20 (B20) summit – an event which is part of the G20 Summit – the Health Minister of Indonesia, Budi Gunadi Sadikin, advocated for a worldwide expansion of China’s program in order to monitor the vaccination and infection status of individuals wishing to travel. 


At the B20 Summit Budi Gunadi Sadikin, Indonesian Health Minister calls for a digital health certificate:

“Let’s have a digital health certificate acknowledged by WHO. If you have been vaccinated or tested properly, then you can move around…” pic.twitter.com/cFYhgu2xTT

— ❣️Anne❣️ (@USA_Anne711) November 15, 2022


Sadikin noted that the constituent countries of the G20 – which includes the United States – have already agreed to such a program, although it is not clear when or how it will be implemented.

“Indonesia has achieved, G20 country has agreed, to have this digital certificate using WHO standard, and we will sub it into the next World Health Assembly in Geneva as the revision to international health regulation,” he said. “So, hopefully for the next pandemic, we can still see some movement of the people, some movement of the goods, and movement of the economy.” 


Link to online version: https://www.publishedreporter.com/2022/12/23/g20-summit-declares-use-of-controversial-covid-health-monitoring-app-currently-used-by-china/

Posted in Uncategorized | Leave a comment

Rod Serling on Covid-19 jab

Bill Whittle explains in the following video how so many people fall for it.

And in the next longer but entertaining and instructive video is an example of what YOU and I can do about this epidemic of misplaced trust. Click on the picture.

Posted in Uncategorized | Leave a comment

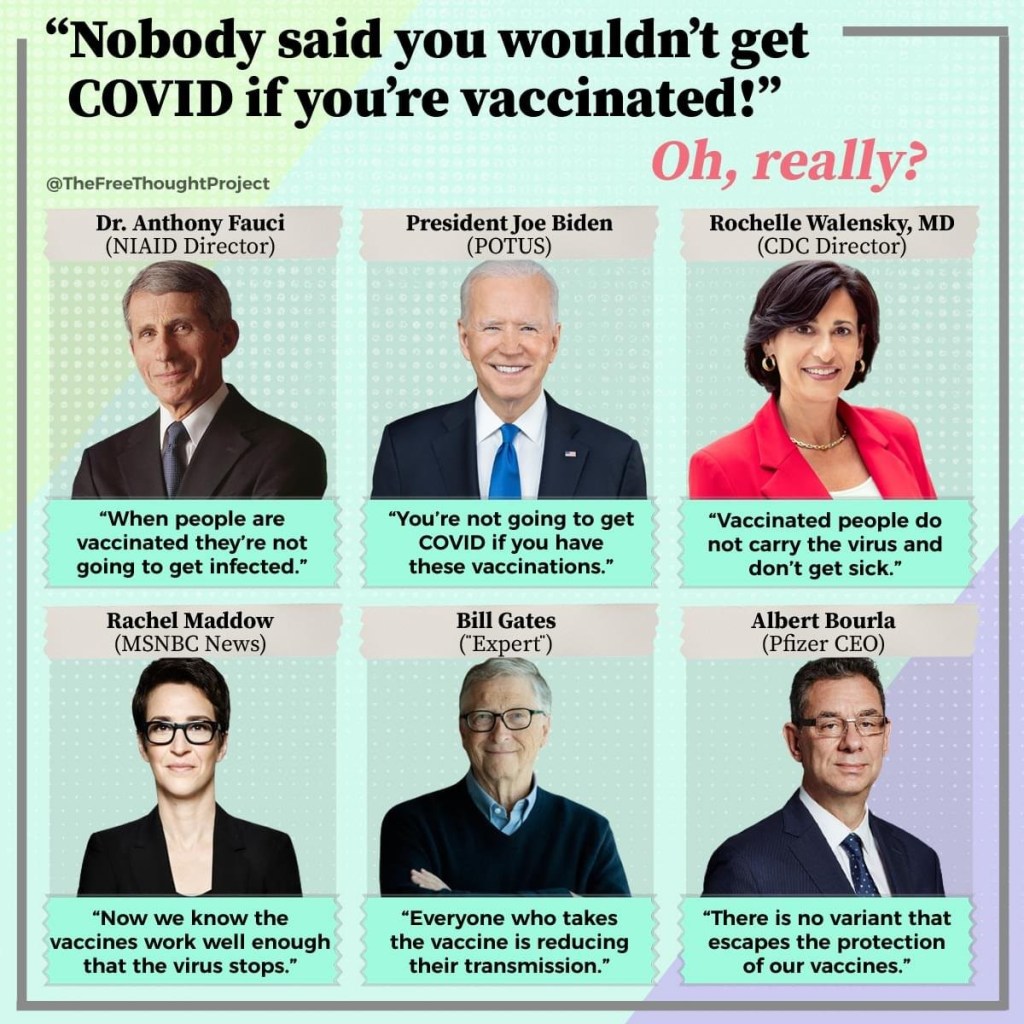
Next these same people will tell you “Nobody said you wouldn’t die if you’re vaccinated.” But 80% of those dying now are vaccinated, and many healthy people are dying suddenly.

Posted in Uncategorized | 1 Comment

Definitive autopsy evidence of vaccine-induced heart inflammation and death, “lethal-vaccine associated myocarditis,” from German pathologists and histologists

Dr. John Campbell

Autopsy-based histopathological characterization of myocarditis after anti-SARS-CoV-2-vaccination

Clinical Research in Cardiology (2022)

https://link.springer.com/article/10.1007/s00392-022-02129-5#Sec3

Posted in Uncategorized | 3 Comments

FBI working with social media companies to censor speech

@Eric_Schmitt Attorney General and U.S. Senator-Elect from Missouri

BREAKING: In our deposition of FBI agent Elvis Chan on Tuesday, we found that the FBI plays a big role in working with social media companies to censor speech – from weekly meetings with social media companies ahead of the 2020 election to asks for account takedowns.

And there is this Fox News report: “FBI met weekly with Big Tech ahead of the 2020 election, agent testifies.”

https://www.foxnews.com/politics/fbi-weekly-big-tech-ahead-2020-election-agent-testifies

Posted in Uncategorized | 1 Comment

Switzerland, Facing an Unprecedented Power Shortage, Contemplates a Partial Ban on the Use of Electric Vehicles

It turns out that you can have battery-powered cars, or you can have renewable energy, but you can’t have both.

“The Federal Council of Switzerland has therefore published draft legislation, which outlines four tiers of escalating measures to conserve electricity and avert potential blackouts. The first prescribes a lot of temperature restrictions for things like refrigerators and washing machines. The second includes more unusual rules, such as the demand that heating in clubs and discotheques “be set to the lowest level or switched off completely,” and that “streaming services … limit resolution of their content to standard definition.” The third foresees cutting business hours, banning the use of Blue Ray players and gaming computers, and also limiting the use of electric cars, which should be driven only when absolutely necessary. A fourth and final tier mandates closure of ski facilities, casinos, cinemas, theatre and the opera.”

Also see http://www.epaw.org/ The European Platform Against Windfarms, which includes 480 organizations.

or, for North America, http://www.na-paw.org/ the North American Platform Against Windfarms

Posted in Uncategorized | Leave a comment

U.S. Democrats either buy votes or steal votes, then their media cronies try to persuade you that the election was fair and legitimate

Tom Fitton @TomFitton

Gavin Newsom’s reparations committee will recommend handing out $223,200 per person to all descendants of slaves in California for ‘housing discrimination’ at a cost of $559BN – in nation’s biggest restitution effort ever https://mol.im/a/11491263 via

@MailOnline

dailymail.co.uk

We are witnessing regression to third world tyranny typical of centuries past. If you are in California, you would be well advised to get out while you can because there is no effective political opposition to this destruction.

Posted in Uncategorized | 1 Comment

VoterGA Releases Evidence of 20,000 Votes Being Removed from Herschel Walker’s Reported Totals in November Election

By Joe Hoft
Published December 2, 2022 at 11:30am

Posted in Uncategorized | 1 Comment