Simple math can be used to calculate the rate of change of one variable versus another variable. The rate of change of one variable versus another is known as its slope or velocity, also known as its first derivative. The change in atmospheric CO2 concentration over a period of time is the slope of CO2 concentration, or the first derivative of CO2 concentration with respect to time. The change of slope with respect to time is the second derivative, also known as acceleration. We can use this simple math to calculate the change of atmospheric CO2 concentration versus time, that is, the slope or 1st derivative of CO2 concentration. And, we can also calculate the change in slope of CO2 concentration versus time, that is, the second derivative of CO2 concentration with respect to time, or the acceleration of CO2 concentration. This simple math is the basis of this letter.
Decades ago, a professor named Keeling set up a laboratory on the Big Island of Hawaii at 11,000 feet altitude on the side of Mauna Loa. The instruments in this laboratory have been measuring atmospheric CO2 concentration since then. These measurements show atmospheric CO2 concentration has been steadily increasing since the instruments on Mauna Loa were installed. In other words, the laboratory provides us with the slope of atmospheric CO2 concentration, which is also known as the first derivative of atmospheric CO2 concentration with respect to time. Since CO2 is generally accepted to be a well-mixed gas in air, the Mauna Loa data is generally accepted to represent the global average atmospheric CO2 concentration.
Here is the graph from the Keeling laboratory on Mauna Loa.
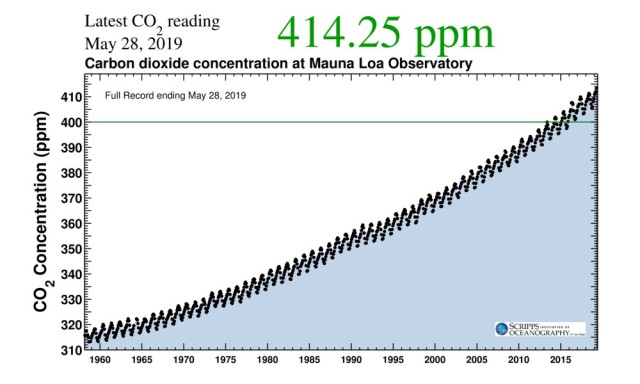
In the data files underlying the above graphic, we have the raw date to calculate the change of atmospheric CO2 concentration over time (the slope or first derivative) as well as the rate of change of slope over time (the second derivative with respect to time.)
In the graphic and raw data, we can see the increase and decrease in CO2 levels due to seasonal changes. This seasonal change appears as jagged shark’s teeth on the consistently upward sloping CO2 concentration. In the spring and summer, when plants are growing and oceans are warming, CO2 concentration increases slightly. In winter, when plants lose their leaves and algae die, and oceans cool, CO2 concentration decreases slightly. The instruments in the lab on Mauna Loa and the Keeling graph are sensitive enough to record these relatively minor seasonal CO2 concentration changes within the overall data and graph of changing CO2 concentration over time. In other words, we can see the second derivative of CO2 concentration, the change in slope with respect to time, in the graphic.
We know from other sources CO2 concentration was increasing long before data collection began at the Mauna Loa Keeling lab. But, we do not need that information for the purpose of this short paper.
The Keeling graph reports 414 CO2 molecules per 1,000,000 molecules of air in the earth’s atmosphere, or 414 ppm, or 0.0414%. PPM is only one of several different possible measures of concentration. The other air molecules in air are nitrogen, oxygen, argon, water vapor and various trace molecules. CO2 is one of those trace molecules. Nitrogen and oxygen together make up 97% to 98% of the total molecules in air. Argon (Ar) is slightly less than 1% concentration. Water vapor concentration in air is highly variable, from less than 1% to 4%. CO2, methane, ozone and the other gas molecules in air are known as trace molecules and all of these trace molecules taken together make up less than 1% of the molecules in a volume of air. A cubic meter volume of air at sea level is 99.9% empty space. Air is not dense compared to any liquid such as water where molecules are so closely packed together that they are in physical contact and can share electrons and conduct heat among them.
The 414 ppm or 0.0414% concentration of CO2 in air represents the net sum of all CO2 absorption and desorption events on earth. It is the sum of trillions of events which are occurring every second.
For example, the oceans in the far north and in the far south are absorbing CO2 because cold water absorbs and holds more CO2 than warm water, like a cold soda pop keeping its CO2 bubbles. Another example is the absorption of enormous amounts of CO2 from the air by all green plants. All green plants use CO2 from the air along with water and sunlight in a process called photosynthesis which converts CO2 into carbohydrate molecules. Sugars are a group of common carbohydrate molecules. Carbohydrate molecules are the building blocks for all plant cells. Animals, insects, fish, humans, all life on earth is based on carbohydrate molecules in cells which are made by green plants from carbon, water and sunlight. Animals, insects, fish etc. eat plants, then those plants are in turn eaten by other animals, insects, fish, humans and so on in a continuous process called the food chain.
Another example of an enormous and ongoing change in CO2 that contributes to the net atmospheric CO2 concentration is methane (CH4) emissions. Methane is continuously emitted by warm water, just as is CO2, and is continuously absorbed by cold water, just as is CO2. About 50 to 60 times more CO2 molecules are dissolved in the water of earth’s oceans compared to earth’s air. This ratio, expressed as a partition co-efficient, is determined by Henry’s Law. It is a constant of nature. It’s not a theory nor a hypothesis, it is a scientific law that is more proven and far better understood than gravity or how a radio amplifier works. Henry’s Law determines the ratio partition of a gas between liquid water and the gas above the liquid water. Henry’s Law is dependent on the pressure of the gas, the temperature of the gas and water, and to minor extent the minerals like salt in the water. Since air pressure at sea level is nearly constant, the primary determinant of the amount of CO2 in air is the temperature of ocean water. Oceans are like your soda pop. If the soda pop is cold, then the CO2 bubbles stay in the pop. If the soda pop warms, the pop loses its CO2 bubbles. As mentioned, determined by Henry’s Law, there is 50 to 60 times more CO2 in the oceans. Warm ocean water emits huge amounts of CO2 and methane which contribute to the net atmospheric CO2 concentration reported in the Keeling Mauna Loa data. The largest source (by orders of magnitude) of CO2 and methane in the air is the emission of these molecules by warm water in oceans and soils. CO2 and methane are absorbed back into cold water in amounts also as determined by Henry’s Law, which also is a component of the net atmospheric CO2 concentration reported in the Keeling Mauna Loa data.
Chemists know that methane (CH4) released into the open air at the average temperature and air pressure at sea level converts spontaneously (oxidizes) to CO2 and H2O when in the presence of a gaseous molecule such chlorine. On average, a CH4 molecule in air will be oxidized to yield a CO2 molecule and a H2O molecule within 8 years, a natural process occurring continuously. Chlorine is found naturally near the surface of warm salty ocean water. Oceans cover more than 70% of the earth’s surface. Like CO2, most methane is emitted from warm ocean water. Secondly, methane is emitted from the natural breakdown of plant material in soil. In other words, methane emitted by warm ocean water and soil is also a huge source of CO2 in the earth’s atmosphere and is a component of the net atmospheric CO2 concentration reported in the Keeling Mauna Loa data.
Thus, the slope (or first derivative) of net atmospheric CO2 concentration which we see in the above Keeling curve is determined mostly by Henry’s Law which is determined mostly by the temperature of the oceans. The warming oceans since the end of the last ice age are the dominant source of net atmospheric CO2 concentration.
Summarizing so far, we have a huge amount of absorption of CO2 by nature and a huge amount of emission of CO2 by nature. The net sum of all these absorption events and emission events appears as the upward sloping line of the net atmospheric CO2 concentration as measured by the instruments on Mauna Loa and displayed in the graphic above.
But what about human-produced CO2? Most human-produced CO2 results from burning methane, propane, butane, gasoline, kerosene, jet fuel, oil and coal. We commonly lump these together and call them fossil fuels. But, a second major source of human-produced CO2 is the production of cement.
Government agencies, academia and industry scientists estimate that CO2 emissions from humans burning fossil fuels increased by 300% (approximately 15% per year) since the year 2000. Measured in millions of tons of CO2 or carbon, this appears to be a large amount and a large increase. It is calculated based on the CO2 emitted by burning an amount of fossil fuel. It is not a measurement of CO2 in the atmosphere. Statistically or visibly examining the slope (first derivative) or examining the rate of change of slope (second derivative) of net atmospheric CO2 concentration in the Keeling data, this apparently large amount of human-produced CO2 since 2000 is not detectable as a change in the first or second derivative. There are no ‘shark’s teeth’ or other peaks or anomalies caused by the surge in human CO2 emissions; there are no detectable changes in first or second derivative due to the emission of this apparently large amount of human-produced CO2 which has been emitted into the atmosphere in the relatively short period of time since year 2000. The emissions of human-produced CO2 are so tiny compared to the net atmospheric CO2 concentration that the human-produced emissions cannot be measured or detected as a change in net atmospheric CO2 concentration, nor a change in the rate of change of net atmospheric CO2 concentration. In science and statistics, we say that the human-produced CO2 is statistically insignificant with regard to the net atmospheric CO2 concentration. The human contribution of CO2 to the net CO2 flux cannot be differentiated from random noise in the measurement of the very much larger net atmospheric CO2 concentration. Therefore, human-produced CO2 has no measurable effect on our environment nor on earth’s temperature nor on global warming nor on global cooling.
Accordingly, it follows logically that humans could not change the planet’s temperature by either increasing or decreasing the amount of CO2 in the air. If humans stopped using all fossil fuels and even stopped breathing, there would be no detectable change in the net CO2 concentration in the air. The planet will warm, or the planet will cool, or the planet’s temperature will be flat as an average, climate will change, but in any case, human-produced CO2 does not significantly contribute. It is very important to understand that point.
Therefore, everything else regarding anthropogenic “greenhouse gases” and so-called anthropogenic global warming or anthropogenic climate change is a purely academic subject. Interesting to some people, but an academic subject. Hundreds of computer models have been developed costing many millions of dollars to calculate “greenhouse” warming due to anthropogenic CO2 (including the burning of fossil fuels, the volume of cow farts, the eating of meat, etc.), but all of these are purely academic subjects for discussion and study. They have no measurable effect on earth’s climate.
Professor Dr. D J Easterbrook BSc, MSc, PhD Prof Emeritus Geology Western Washington University pointed out in 2015 that “CO2 is not the “greenhouse effect.” AGW CO2 is adding 0.0000000006342 watts/m²(joules/second.” This is a calculation only. There is no method to actually measure such a small amount of energy. “Water Vapor is 90-95% of the “greenhouse effect.””
Regarding methane (CH4) as a “greenhouse gas,” on a molecule by molecule comparison between CO2 and CH4, CH4 absorbs about 80 times more infrared radiation during a 20-year period than CO2. But, on the other hand, CO2 concentration is two orders of magnitude more than CH4 concentration. And, the reason for this, as explained earlier, is that the methane spontaneously oxidizes to CO2 and H2O in the open air. The amount of infrared absorption by a gas is determined by Beer’s Law, which specifies that amount of infrared radiation absorbed is linearly proportional to the concentration of the gas. Thus, CO2 absorbs far more infrared radiation than CH4, and water vapor – which is about 100 times higher concentration than CO2 – absorbs far more infrared radiation than CO2. Obviously, humans have no means to control water vapor.
Another part of the earth’s carbon cycle is worth mentioning again. The slope of net atmospheric CO2 concentration in the air has been consistent since the end of the last ice age. Net atmospheric CO2 concentration has been increasing. Henry’s Law says that 50 to 60 times more CO2 is dissolved in the oceans than in the air. Logically that implies that the amount of CO2 in the oceans is now and has been decreasing since the end of the last ice age. So, what happens to the CO2 that is dissolved in the oceans? This is a major part of the earth’s carbon cycle. CO2 dissolved in water is a weak acid. This weak acid reacts with calcium (for example but also other minerals), which are dissolved in ocean water. There is far more calcium on earth and dissolved in the oceans than the total amount carbon in all its forms on earth. There is enough calcium in ocean water to chemically combine with all of the carbon that exists on earth. Aquatic chemists describe this as oceans being an infinite sink for carbon. This weakly acidic form of carbon dioxide in water combines with calcium in water to form limestone, also known as calcium carbonate, or CaCO3. Limestone is a solid which settles in water to become a sediment on the floor of oceans and seas. Over years of sedimentation, the limestone is compressed by more and more sediment and becomes rock, or it could be incorporated by mollusks and small sea life into their shells and skeletons.
Humans harvest limestone to make buildings and floors. We also burn limestone at high temperature, which is how cement is produced. Burning of limestone to produce cement releases CO2 back into the atmosphere where once again it can be absorbed by plants to start the carbon cycle again. The other way limestone releases CO2 back into the air is by the high heat from volcanoes, fissures in the earth and similar tectonic events. There are perhaps thousands of these events continually occurring on land and on the ocean floor, a process which has been occurring continuously for billions of years. The CO2 emitted from tectonic heating of limestone contributes to the net atmospheric CO2 concentration we see in the Keeling Mauna Loa data. These tectonic processes are orders of magnitude larger than anything humans could do.
In another part of the carbon cycle, enormous amounts of methane (CH4) are formed on the continental shelves in the ocean in a chemical complex with water and a mineral. It is a slurry similar to mud, which, if you bring it to the surface, can be lit with a match. The amount of CH4 in this slurry and silt on the floor of the oceans is far larger than the total amount of oil ever discovered, perhaps larger by three orders of magnitude. Where does it come from? This methane is the product of slow and continuous degradation of the carbohydrate molecules in the cells of every living thing. When the cells die and are digested down through the food chain by one animal, insect, fish, human, bacteria after another, when it is rotted, then methane remains. When the molecular bonds in the carbohydrate polymer molecule are broken, the eventual result is methane and water. Rain and rivers eventually carry that CH4 into the oceans, or else it is emitted into the air and oxidized to CO2 as previously described. This degradation process and the food chain described earlier are part of what is known as the earth’s carbon cycle.
The slurry complex is known as methane clathrate or methane hydrate. In places around the world there are pools of clathrates that are kilometers thick or slowly flowing down the walls of canyons in the oceans. Near the boundaries of continents and oceanic plates, deep under the oceans, are subduction zones where the plates of ocean floor meet the continents and are pressed (subducted) beneath the continental shelves. Clathrate slurries of methane are subducted beneath the continents along with the oceanic plate. In a very slow process taking millions of years but occurring continuously for billions of years, methane under heat, pressure and containment is reformed into longer and more complex hydrocarbons. The CH4 forms bonds with other CH4 and larger hydrocarbon molecules are created. This is the reason we will continue to find more gas and oil and the reason we find gas and oil miles beneath the continents and ocean floor where life has never existed. The movement of the oceanic plates and continents has been as is today creating oil from the continuously dying and rotting cells of living matter, the slow and continuous breakdown of carbohydrate molecules that were originally created by plants absorbing CO2 from the air.
In summary, the human contribution to the net atmospheric CO2 concentration and to the temperature of the earth is trivial and statistically insignificant. Negligible. Of academic interest only. How insignificant? As an example, let’s say that the earth was cooling, and humans decided to warm the oceans in order to warm the air. Water is denser than air, so water retains heat better than air. The heat content of the oceans is about 3 orders of magnitude greater than the atmosphere, 5.6 X 10^24 compared to 5 X 10^21 Joules/degree Kelvin. If we calculate or look up on a website the total power output of all of the power facilities of all kinds on earth, and then assume we will use all of that power to heat the oceans and do nothing else with that power, it would take about 10,000 years to raise the temperature of the oceans by a mere one degree centigrade. That is how insignificant the human contribution would be.
However, working to make engines better and fossil fuels burn as efficiently as possible will make our lives more pleasant. But it is not CO2 that is dirty, or polluting. As explained above, CO2 is plant food and necessary for life on this planet. More CO2 is better. But inefficiently or partially burned fossil fuels release hydrocarbons like benzenes into the air which are not good; that is true air pollution. Reducing real hydrocarbon pollution from inefficient fuel mixtures and inefficient engines is the engineering and chemistry challenge for humans. Attempts and costs to remove or reduce human-produced CO2 are wasted effort and money.
Also, plastics that have been designed to be non-bio-degradable or non-recyclable. They are ugly to look at, problematic garbage, and destructive for sea life, birds, insects, etc. Ultimately, these poorly designed plastic products are harmful to the environment and delay the carbon cycle. But these materials too will eventually break down over long periods of time and release CO2 into the air so that it can feed plants. Bio-degradable plastics are sensible.
So long as we are discussing the purely academic subject of AGW, there are a few other points worth noting.
Antarctica and Greenland are currently accumulating ice mass, not losing ice mass. The peninsula of Antarctica that points north toward Argentina has been warming due to sub-ice and sub-sea volcanic activity. That area has been losing ice on land and sea, but in the last few years, overall the Antarctica continent a net increase of ice on land is observed. The ice mass gained on land exceeds the ice mass lost on land. The ice mass on land is increasing and becoming thicker. The weight of that ice is causing an increase in glacial calving at the coastlines. And all of this is also observed in Greenland.
Once again, we come back to slope. The rate of change in sea level (i.e. the slope) has not changed. That is, the second derivative of sea level has not changed. Sea level has been increasing (i.e. the slope or first derivative has been positive) since the end of the last ice age; at that time sea level was perhaps 400 feet below today’s sea level. However, if ice continues to accumulate on land, or if ice mass begins to decrease on land, then we will see a change in the slope of sea levels, (i.e. a change in second derivative of sea level with respect to time.) So far, there has been no detectable change in slope of sea level. Sea level has been very slowly rising.
Ice floating in the oceans or floating in lakes, so called sea ice, does not affect sea level.
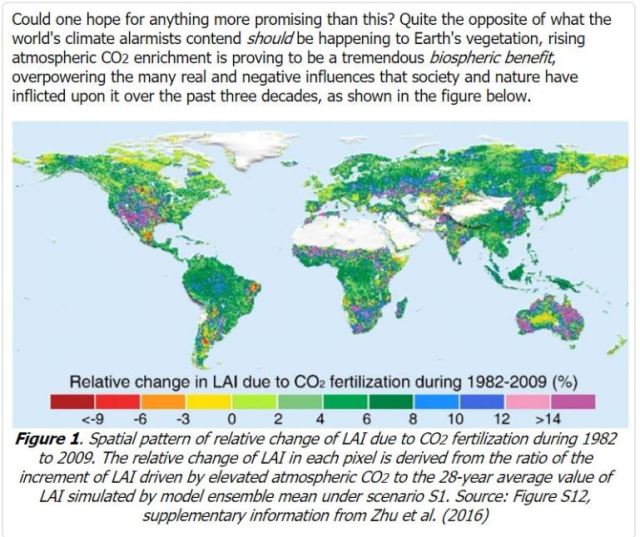
Multiple studies by NASA and others show that the earth is becoming greener as the net atmospheric CO2 concentration has increased. Many science studies, and databases of studies, show that more CO2 and more warming increases the growth of green plants in forests, in grains and other foods, etc. See graphic below. The human contribution is trivial. But we can all hope that CO2 continues to increase and that temperatures stay flat or once again begin a slow warming trend. Average global temperature has been essentially flat (zero slope) for about 20 years now.
The only way carbon gets into plants and thus into animals, insects, fish, humans etc is when the plants absorb CO2 from the air for photosynthesis. When plants use CO2 to make carbohydrate molecules, they produce oxygen as a byproduct. Humans and most other non-plant life survive on the oxygen which is produced as a by-product of plant photosynthesis. Higher net atmospheric CO2 concentration results in more plant growth. Lower CO2 concentration results less plant growth, which also implies less food and a less green earth.
We now have over 35 years of Landsat satellite imagery showing that a positive (increasing) slope of atmospheric CO2 concentration is greening our planet. Plant life is flourishing.
Finally, satellites measuring infrared radiation emitted from earth’s upper atmosphere into outer space are reporting that infrared radiation from earth to outer space is currently decreasing (i.e. the slope or first derivative is negative.) That means that the earth is receiving less energy from the sun and is therefore emitting less energy into outer space. In other words, the earth is presently cooling. It may take years before we perceive or measure this cooling down on earth’s surface due to the insulating effect of the oceans and atmosphere. The oceans especially act as an enormous insulator, far more than the atmosphere, delaying radiation of energy from the surface back into outer space.
Once again, the impact of human activity on climate change, while purely academic, is interesting to study, but, as you can see from the information provided above, the actions of humans with regard to CO2 emissions will have no measurable impact on global warming or global cooling. Probably the most significant thing we can do is to plant more forests and stop cutting rainforests.
References:
Professor Murray Salby: https://youtu.be/b1cGqL9y548
Professor Jamal Munshi: https://www.academia.edu/14863648/RESPONSIVENESS_OF_ATMOSPHERIC_CO2_TO_ANTHROPOGENIC_EMISSIONS_A_NOTE
This is republished in whole or part here:
Climatic Effects of Manmade Carbon Dioxide
Paperback – December 17, 2019. Chapter 9
and reviewed here:
How To Slay The Climate Change Dragon


You must be logged in to post a comment.