If you do not understand this graphic evidence, then please feel free to comment here. I am confident that over 30,000 scientists and professionals in all walks of life and countries will try to help.
Graphs by John Shewchuk, Certified Consulting Meteorologist (CCM). Lt Col, USAF Retired, Meteorologist. Creator of the RAOB Program Member: CO2 Coalition.
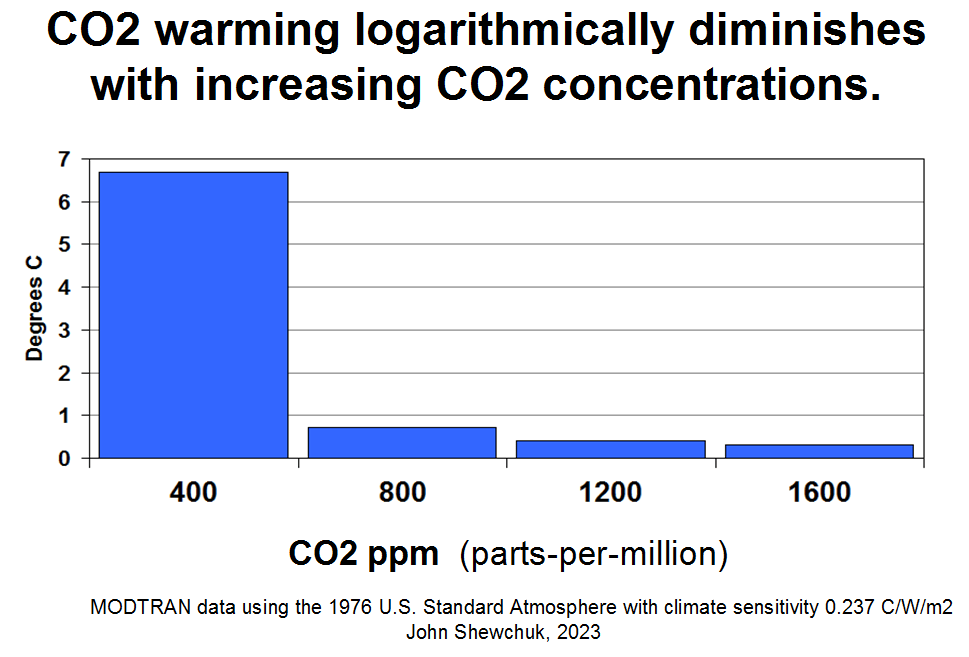
CO2 warming logarithmically decreases with increasing CO2. This graph does not include the cooling affects of increasing CO2 and the overall cooling from clouds.
Bud is a retired life sciences executive. Bud's entrepreneurial leadership exceeded three decades. He was the senior business development, marketing and sales executive at four public corporations, each company a supplier of analytical and life sciences instrumentation, software, consumables and service. Prior to those positions, his 19 year career in Hewlett-Packard Company's Analytical Products Group included worldwide sales and marketing responsibility for Bioscience Products, Global Accounts and the International Olympic Committee, as well as international management assignments based in Japan and Latin America. Bud has visited and worked in more than 65 countries and lived and worked in 3 countries.


You must be logged in to post a comment.