
My comment here was my response to a post on CFACT regarding Governor of Washington State Jay Inslee’s ‘green’ agenda, as well as some other non-science people commenting to that post on CFACT. I have also forwarded this to the governor of Hawaii and mayor of Hawaii island. Share onward if you wish.
There is a large group of former NASA scientists and engineers, the people who sent men to the moon several times, and here is one of their comments from their full report on human-caused climate change. The official NASA website claims without valid evidence that human cause is “unequivocal”. But thousands of scientists including NASA scientists and engineers dispute that official NASA claim.(1)
Here is a quote from “The Right Climate Stuff” team of NASA engineers and scientists: “We believe the claims by NASA and GISS, that man-made carbon dioxide is having a catastrophic impact on global climate change are not substantiated…With hundreds of well-known climate scientists and tens of thousands of other scientists publicly declaring their disbelief in the catastrophic forecasts, coming particularly from the GISS leadership, it is clear that the science is NOT settled.” Quoted from: Gus Lubin. “49 Former NASA Scientists Send A Letter Disputing Climate Change,” Business Insider, April 11, 2012.
You can read their full report titled “The Right Climate Stuff” here: https://www.therightclimate…
NASA and particularly NASA GISS (their climate modelers) was part of the international scam and scandal known as ClimateGate. NASA is well known and documented to be altering climate records to fit their agenda. Of course you can find disreputable sites like SkepticalScience, so-called fact checkers, The Guardian, etc. and each denies The Right Climate Stuff report and attempts to smear these NASA scientists and engineers.
Meanwhile, climate scientists who support human-caused global warming, for example Ben Santer and Michael Mann, authored a paper in Nature GeoScience which acknowledges that their climate models are wrong, although their admission is buried in weasel words and technical jargon: “In the early twenty-first century, satellite-derived tropospheric warming trends were generally smaller than trends estimated from a large multi-model ensemble,” reads the first line of the abstract. In other words, the actual temperature trends were less than their models. Their climate models, which are no more than unproven hypotheses, cost taxpayers billions of dollars. And they want trillions more dollars, $9 trillion per year according to consultants McKinsey & Co. Michael Mann (of the infamous and now repudiated “hockey stick” graphic in Al Gore’s science fiction movie) as well as other alarmists are co-authors on the paper (link below). They gave us another revealing quote in the NatGeo paper: “Over most of the early twenty-first century, however, MODEL tropospheric warming is SUBSTANTIALLY LARGER THAN OBSERVED,” reads the abstract (Capital letters are mine for emphasis.) In other words, their computer models substantially overestimated the global warming which has been observed in the real world. Full paper as pdf in Nature Geoscience HERE: http://www.meteo.psu.edu/ho…
On the other hand, there are many lists of highly regarded scientists, including Nobel Prize Laureates in the hard sciences, containing thousands of names, credentials, etc. who repeatedly refute the fraud that is human-CO2-caused global warming/climate change. One of those lists with over 1000 signed is found at CFACT.
Here is another one of many lists of “skeptics.” Yet the deplorable NASA page posted by Hope in comments claims it is “unequivocal” that humans are the cause, and presidents like Obama, prime ministers, etc. repeat the lie that 97% of scientists believe humans are causing climate change. The following group of scientists is extracted from a much larger group who signed the Manhattan Declaration which states in part: “Now, therefore, we recommend – “That world leaders reject the views expressed by the United Nations Intergovernmental Panel on Climate Change as well as popular, but misguided works such as “An Inconvenient Truth”.,, “That all taxes, regulations, and other interventions intended to reduce emissions of CO2 be abandoned forthwith.” The 206 endorsers at the following link are climate science specialists or scientists in closely related fields. https://budbromley.blog/201…
CO2 is 0.04% of atmosphere. That is 414.24 ppm divided by 1,000,000 = 0.0004 then 0.0004 X 100 = 0.04%
The NOAA Mauna Loa laboratory reported the average annual increase in CO2 from 2019 to 2020 was 2.58 ppm. That is 414.24 ppm for 2020 minus 411.66 ppm for 2019. 414.24 – 411.66 = 2.58 ppm. That is 2.58 X 10^-6. Then multiply by 100 to get the percentage. 2.58 X 10^-6 x 1 X 10^2 = 2.58 X 10^-4 % or 0.000258%. For 2020, the increase in CO2 due to the sum of all CO2 sources (both natural and human) and all CO2 sinks (both natural and human) was only 0.000258%. Net human CO2 emissions for 2020 was some unknown and poorly estimated amount less than 0.000258% of atmosphere.
This means the increase in CO2 for 2020 due to all CO2 sources and sinks, human and natural, was only 0.6% of the total CO2 for 2020. That is, 2.58 ppm divided by 414.24 ppm = 0.006228. As a percent that is 0.6228%. Net human CO2 emissions for 2020 (i.e., net human CO2 emissions minus net human CO2 absorption into the environment) cannot exceed 0.6% of net global average CO2 concentration for 2020, since that 0.6% includes the net sum of CO2 from all CO2 sources and all CO2 sinks, natural and human.
To be scientifically correct, these numbers should be expressed in “scientific notation” with “significant figures.” You can look that up if you do not recall the definition of scientific notation and significant figures. Simply said, the smallest numeral shown should contain the variation. No smaller numbers should be shown. Net global average atmospheric CO2 concentration for 2020 should be expressed as 414 ppm +/- 4 ppm or 0.0414% +/- 0.0004%.
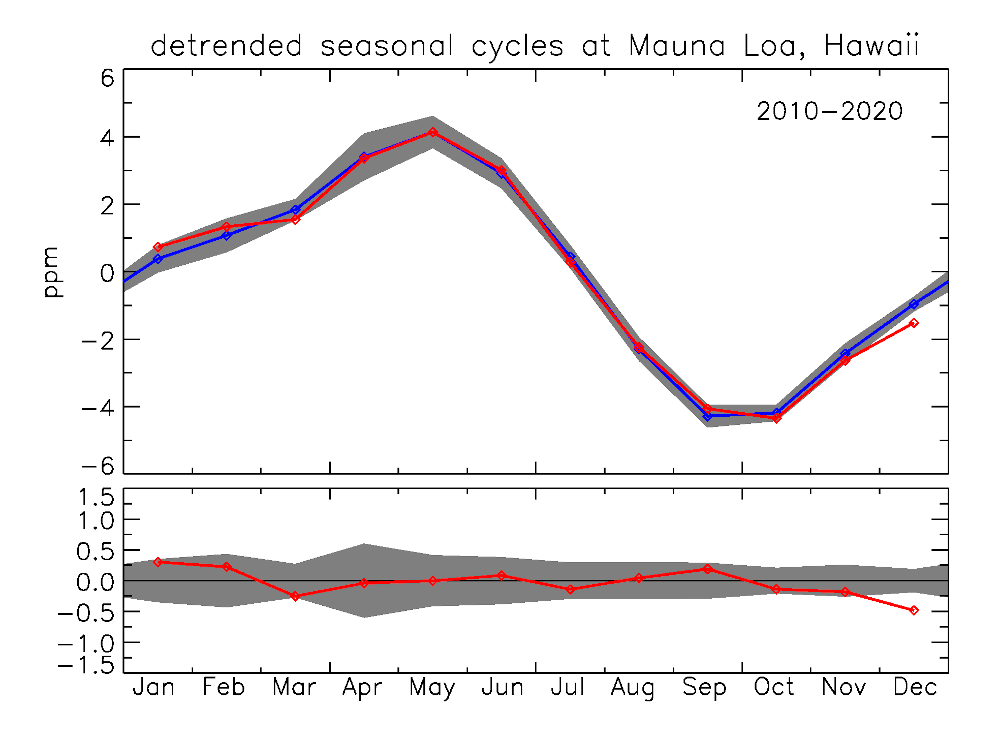
The detrended annual variation at the NOAA-Scripps Global Monitoring Lab on Mauna Loa is greater than +/- 4 ppm. That’s >8 ppm variation in total during the year. See the attached graph (above) from NOAA’s Global Monitoring Laboratory for 2020. Their caption for this graph is “At the Mauna Loa Observatory, after removal of the long-term increase of CO2, the purely seasonal component is left. It is almost entirely caused by terrestrial plants and soils. The blue line is the average seasonal cycle during 2010-2020. The gray band shows the variability of the seasonal cycle (one standard deviation) in different years. The red line is the seasonal cycle during 2020 so far. The lower panel only shows deviations from the blue line above for both the gray uncertainty band and the red line.”
As seen in the NOAA graph, the detrended annual variation at Mauna Loa is greater than +/- 4 ppm. In other words, since 2.58 ppm is less than the detrended annual variation +/-4 ppm, then it is in fact too small to be reported in scientific notation. And, it is also too small to be quantified with analytical precision. 2.58 ppm or 0.000258% is not scientifically reproducible, it is buried in the variation, it cannot be distinguished from random variation in the data. There is a “limit of detection” and a “limit of quantification.” 2.58 ppm is enough to be detected but not enough to be reproducibly quantified, below the limit of quantitation. NOAA is not using digital signal processing, so signal needs to be about 3 times noise variation. But NOAA’s detrended noise variation is greater than 3 times signal. In other words, the net increase in global CO2 for 2020 of 0.000258% is scientifically and analytically useless; it is incorrect and imprecise in scientific terms.
Precisely said, there was no increase in the average global CO2 concentration measured at NOAA Mauna Loa’s Global Monitoring Laboratory for 2020.
We all know that there was a nearly worldwide lockdown on the world’s economy in 2020. This no doubt reduced CO2 emissions from use of fossil fuels. But NOAA Mauna Loa reported no measured decrease in net global CO2 concentration for 2020.
Bromley and Tamarkin (2022) reproduced NOAA data using digital signal analysis of NOAA’s daily CO2 measurements. The results clearly show that CO2 concentration decreased during the 2 years after the June 1991 Pinatubo volcano eruption, decelerating rapidly to zero rate of change and slightly below for a short time, then in the next 2 years accelerating more rapidly (than it had decelerated) back to the previous rate of increase and slightly above. There was no time delay in absorption of CO2 from the atmosphere as is claimed by NOAA, NASA, etc. as their misleading and false excuse for no measured decline in CO2 for 2020.
In other words, if human CO2 emissions were a statistically significant component of net global average CO2 concentration, then a decline (in fact a rapid rate of decline), would have been observed in the NOAA CO2 measured at Mauna Loa. Bromley and Tamarkin (2022) (https://budbromley.blog/202… ) illustrated that the NOAA data is sensitive enough to do that. However, since no decline in net global CO2 was measured despite the global decline in use of fossil fuels in 2020 due to the pandemic lockdown, then we confidently infer that human CO2 emissions from fossil fuels are statistically insignificant (and therefore negligible) with regard to net global average CO2 concentration and with regard to alleged warming.
The conclusion is obvious. Since human-produced CO2 from fossil fuels is an insignificant and negligible component of net global average CO2 concentration, then human-produced CO2 from fossil fuels is also an insignificant and negligible component of global warming.
The global warming / climate change agenda is a fraud. There is no climate crisis. In the words of MIT professor of meteorology Richard Lindzen, “Stop treating it [i.e. AGW…human-caused global warming/climate change] as a worthy opponent. Do not ascribe reasonableness to the other side. It is not reasonable, not true, not even plausible.”
Other related posts:
(1) Partial lists of lists, letters and declarations against the global warming agenda
The Heidelberg Appeal; ~4000 signers, ~ 70 Nobel laureates
The CLINTEL Letter to United Nations: “There is no climate Emergency.” ~ 1500 signers
The Oregon Petition; ~31,000 signers, ~9,000 PhDs
Open Letter to UN Secretary General;
The Petition by German Scientists to the Chancellor;
The Leipzig Declaration https://henryhbauer.homestead.com/Leipzig_DeclarationPontius2005.pdf
Statement from Atmospheric Scientists;
Statement from scientists to President Obama.
——————————–
#ClimateChange #IPCC #GlobalWarming #ClimateCrisis #Sustainability #NetZero #EPA #EndangermentFinding #CO2 #ClimatePolicy #EnergyPolicy #FossilFuel #Henry’sLaw

Pingback: Energy and Environmental Review: February 27, 2023 - Master Resource
Pingback: The Media Balance Newsletter: 27/2/23. - Australian Climate Sceptics blog
Pingback: AWED MEDIA BALANCED NEWS: We cover COVID to Climate, as well as Energy to Elections. - Dr. Rich Swier
I found surprisingly little to quibble about, and much to agree with, in the first half of this blog post.
But, starting with the ridiculous claim that “Human CO2 emissions for 2020 was some unknown and poorly estimated amount less than 0.000258% of atmosphere,” that and ALL of the rest is wrong.
“Fossil CO2 emissions” are estimated, quite precisely, from economic data: production statistics for coal, oil, natural gas, and cement. “Land use change emissions” are much more poorly constrained, but because they’re much smaller than fossil CO2 emissions they don’t add much uncertainty to the total. Here are two summations of anthropogenic CO2 emissions in 2020:
The Global Carbon Project‘s (GCP) estimate is:
9066 MtC from fossil fuels + 111 Mtc from gas flaring + 447 from cement manufacturing = 9624 MtC fossil carbon emissions in 2020
+ (639 to 1461, avg 1107) MtC due to “land use changes” = 10731 MtC total anthropogenic emissions in 2020.
BP doesn’t attempt to estimate “land use change” emissions (forest clearing, swamp draining, etc.). They estimate:
8755 MtC from fossil fuels + 82 Mtc from gas flaring + 447 from cement manufacturing (Andrew 2022) = 9284 MtC fossil carbon emissions in 2020.
Note that BP’s calculation for fossil carbon emissions is only 3.5% lower than the GCP’s. The closeness of those figures reflects the good precision with which production statistics are known for fossil fuels.
1 PgC = 1000 MtC = 0.46962 ppmv CO2, so the smaller figure (BP’s 9284 MtC) is equal to (9284/1000) × 0.46962 = 4.36 ppmv CO2 (i.e., 0.000436% of the atmosphere, not “less than 0.000258%”).
That’s a low-end estimate of the amount of fossil carbon which mankind added to the atmosphere in 2020. It doesn’t include land use change emissions, which the GCP estimates to be between 0.30 and 0.69 ppmv.
In the first quarter of 2020, CO2 concentration measured at Mauna Loa averaged 414.230 ppmv.
In the first quarter of 2021, CO2 concentration measured at Mauna Loa averaged 416.637 ppmv.
The difference is the approximate increase from net 2020 CO2 fluxes (emissions & removals): 416.637 – 414.230 = approx. 2.41 ppmv.
So in 2020 mankind added more than 4.36 ppmv of CO2 to the atmosphere, yet the net change was an increase of only 2.41 ppmv.
That means nature removed a net total of more than 4.36 – 2.41 = 1.95 ppmv of CO2 from the atmosphere in 2020.
You can learn more about this topic here:
👉 http://www.ferdinand-engelbeen.be/klimaat/co2_origin.html
👉 https://sealevel.info/carbon/carbonflux.html
Please perlustrate those two linked references. W/r/t the second one (mine), if you find anything there which is unclear or unpersuasive, I will be grateful if you point it out to me. (It is a work in progress.)
Note: some of the links above use “text fragment links” to take you directly to specific highlighted snippets on the linked web pages. Unfortunately, that feature does not work in Firefox, Safari, Brave, Palemoon, LibreWolf, SlimBrowser, or Waterfox. It does work in Chrome/Chromium, Opera, Vivaldi, SlimJet, and Edge.
LikeLike
David, 2.58 ppm was the annual average global net increase in CO2 measured at NOAA Mauna Loa for 2020. It is the average increase in CO2 concentration for 2020 compared to 2019. 2.58 divided by 1,000,000 is 0.00000258. Then 0.00000258 times 100 is 0.000258% 2.58 is the net increase in concentration due to all CO2 sources, natural and human, minus all CO2 sinks, natural and human. Net human emission for 2020 did not exceed 2.58 ppm. Average net global CO2 concentration as measured at Mauna Loa increased by only 0.000258% in 2020. That is simply a restatement of the values reported by the laboratory.
The net global average CO2 concentration reported by the NOAA lab for 2020 was 414.24 ppm. Then, if we divide 2.58 ppm by 414.24 we get 0.006228, if we ignore significant figures for the moment. 0.006228 is 0.6228%. Thus, the net human contribution for 2020 to the net global CO2 concentration as measured at Mauna Loa did not not exceed 0.6228% of net global CO2 concentration.
Measured is a key word in the above paragraphs. The measurement at Mauna Loa is in micromoles of CO2 in dry air. It a mass measurement in ppm, not a volume measurement in ppmv. The measurement is the net sum of all CO2 gas fluxes into and out of the air.
These reference links you are providing are ad hominem and off subject, irrelevant distractions, since NOAA and I are reporting measured net global CO2 emission, which is the residual difference after subtracting all CO2 absorptions from all CO2 emissions. Estimates of the CO2 emissions due to fossil fuel emissions are only about half of the human fossil fuel emission story, that is what makes it ad hominem, a distraction from the subject being discusses. And they are only estimates and models, some based on dubious sources, and sometimes guesswork, which are not as good or definitive as empirical measurements. In science, an empirical measurement trumps estimates. These estimates and models are only hypotheses and theories and they are only valid when and until they correctly explain the empirical measurement.
It may be worthwhile to point out that the NOAA-Scripps Global Monitoring Laboratory (GML Mauna Loa) is only one of several GML labs measuring CO2. These labs rarely if ever report the same results since they are in different locations under different environment variables. This is to say that the GML at Mauna Loa is a generally accepted standard by which to compare the other labs and data; they do not propose, nor do I, that GML Mauna Loa is the true average net global CO2 concentration. CO2 concentration in air varies widely and chaotically.
Due to the volcanic eruption of Mauna Loa here in 2022, the Mauna Loa lab is closed. Some measurements are being made from Mauna Kea volcano nearby about 22 miles by road from the Mauna Loa lab. The road is blocked by lava which is over 6 feet thick in places, and probably much thicker in some places. The road undulates. The lava is probably still hot inside. Eventually, we will need to compare the results from the two labs.
LikeLike
Bud wrote, “2.58 ppm was the annual average global net increase in CO2 measured at NOAA Mauna Loa for 2020. It is the average increase in CO2 concentration for 2020 compared to 2019.”
Yes, that’s roughly an average of the effects of all CO2 sinks & sources in 2019 and 2020.
If you want to see the effects of sources and sinks in just 2020 then it’s better to compare first quarter averages. Here are the figures:
Bud wrote, “2.58 is the net increase in concentration due to all CO2 sources, natural and human, minus all CO2 sinks, natural and human.”
Yes, or about 2.41 ppmv for CO2 sources & sinks just in 2020.
Bud wrote, “Net human emission for 2020 did not exceed 2.58 ppm.”
That’s wrong. It would only be true if natural sinks did not exceed natural sources, which is not the case.
From production statistics for fossil fuels and cement, we know that in 2020 human fossil CO2 emissions were about 4.36 ppmv (BP) or 4.52 ppmv (GCP).
We know that because we know how much CO2 is released from each ton of coal, barrel of oil, and million ft³ of natural gas (14.65 psia, 60°F), and we know how much of each of those were produced & burned, and we also know how much cement was produced and how much CO2 is during the production of a ton of portland cement.
I have those figures on my site, here:
https://sealevel.info/carbon/
Bud wrote, “the net human contribution for 2020 to the net global CO2 concentration as measured at Mauna Loa did not not exceed 0.6228% of net global CO2 concentration.”
That’s wrong. (4.36 ppmv to 4.52 ppmv) / 414.24 ppmv =
1.05% to 1.09%, not 0.6228%.
Bud wrote, “Measured is a key word in the above paragraphs. The measurement at Mauna Loa is in micromoles of CO2 in dry air. It a mass measurement in ppm, not a volume measurement in ppmv.”
That’s wrong. Dry molar fraction (in µmol/mol) is nearly identical to ppmv in dry air.
CO2 is 44.0095 g/mol, and dry air (standard atmosphere) is 28.9647 g/mol, so 420 µmol/mol CO2 = 420 ppmv CO2 = 420×(44.0095/28.9647)= 638 ppmm.
Bud wrote, “These reference links you are providing are ad hominem…”
You keep using that word. I do not think it means what you think it means.
Bud wrote, “irrelevant distractions, since NOAA and I are reporting measured net global CO2 emission, which is the residual difference after subtracting all CO2 absorptions from all CO2 emissions.”
You obviously didn’t bother to read either of the two reference links.
The change in the amount of CO2 in the atmosphere is the net sum of all emissions and removals, by both mankind and nature, not just human emissions. Mankind is adding CO2 to the atmosphere, and nature is removing it (net sum of natural sinks & sources), so obviously mankind’s annual emissions are greater than the annual change in the amount of CO2 in the atmosphere.
Bud wrote, “Estimates of the CO2 emissions due to fossil fuel emissions are only about half of the human fossil fuel emission story, that is what makes it ad hominem…”
1. You keep using that word. I do not think it means what you think it means.
2. Even if you count land use change emissions, CO2 from fossil fuels is currently about 85% of all human CO2 emissions, not “about half.”
Bud wrote, “And they are only estimates and models, some based on dubious sources, and sometimes guesswork… These estimates and models are only hypotheses and theories…”
That’s a fair criticism ONLY of “land use change” emissions.
It’s nonsense for emissions from fossil fuels. To know how much CO2 is produced by completely burning a given quantity of coal, oil or natural gas, all you have to do is calculate how many carbon atoms there are in the fuel. That’s not “models” or “guesswork,” it’s just very basic chemistry.
Bud wrote, “It may be worthwhile to point out that the NOAA-Scripps Global Monitoring Laboratory (GML Mauna Loa) is only one of several GML labs measuring CO2… they do not propose, nor do I, that GML Mauna Loa is the true average net global CO2 concentration.”
Of course that’s covered on my site. The largest deviation in annually averaged measured CO2 levels from the MLO measurements, at any high quality measurement site, is only about 4 ppmv lower. MLO annual averages are probably only about 1 ppmv above the true global average.
Bud wrote, “CO2 concentration in air varies widely and chaotically”
Only at ground level. That’s why measurements are done at high elevations, on ocean-facing mountainsides.
LikeLike
(Sorry, I botched the formatting on my first attempt; please just delete that one, this should be better.)
Bud wrote, “2.58 ppm was the annual average global net increase in CO2 measured at NOAA Mauna Loa for 2020. It is the average increase in CO2 concentration for 2020 compared to 2019.”
Yes, that’s roughly an average of the effects of all CO2 sinks & sources in 2019 and 2020.
If you want to see the effects of sources and sinks in just 2020 then it’s better to compare first quarter averages. Here are the figures:
Bud wrote, “2.58 is the net increase in concentration due to all CO2 sources, natural and human, minus all CO2 sinks, natural and human.”
Yes, or about 2.41 ppmv for CO2 sources & sinks just in 2020.
Bud wrote, “Net human emission for 2020 did not exceed 2.58 ppm.”
That’s wrong. It would only be true if natural sinks did not exceed natural sources, which is not the case.
From production statistics for fossil fuels and cement, we know that in 2020 human fossil CO2 emissions were about 4.36 ppmv (BP) or 4.52 ppmv (GCP).
We know that because we know how much CO2 is released from each ton of coal, barrel of oil, and million ft³ of natural gas (14.65 psia, 60°F), and we know how much of each of those were produced & burned, and we also know how much cement was produced and how much CO2 is during the production of a ton of portland cement.
I have those figures on my site, here:
https://sealevel.info/carbon/
Bud wrote, “the net human contribution for 2020 to the net global CO2 concentration as measured at Mauna Loa did not not exceed 0.6228% of net global CO2 concentration.”
That’s wrong. (4.36 ppmv to 4.52 ppmv) / 414.24 ppmv =
1.05% to 1.09%, not 0.6228%.
Bud wrote, “Measured is a key word in the above paragraphs. The measurement at Mauna Loa is in micromoles of CO2 in dry air. It a mass measurement in ppm, not a volume measurement in ppmv.”
That’s wrong. Dry molar fraction (in µmol/mol) is nearly identical to ppmv in dry air.
CO2 is 44.0095 g/mol, and dry air (standard atmosphere) is 28.9647 g/mol, so 420 µmol/mol CO2 = 420 ppmv CO2 = 420×(44.0095/28.9647)= 638 ppmm.
Bud wrote, “These reference links you are providing are ad hominem…”
You keep using that word. I do not think it means what you think it means.
Bud wrote, “irrelevant distractions, since NOAA and I are reporting measured net global CO2 emission, which is the residual difference after subtracting all CO2 absorptions from all CO2 emissions.”
You obviously didn’t bother to read either of the two reference links.
The change in the amount of CO2 in the atmosphere is the net sum of all emissions and removals, by both mankind and nature, not just human emissions. Mankind is adding CO2 to the atmosphere, and nature is removing it (net sum of natural sinks & sources), so obviously mankind’s annual emissions are greater than the annual change in the amount of CO2 in the atmosphere.
Bud wrote, “Estimates of the CO2 emissions due to fossil fuel emissions are only about half of the human fossil fuel emission story, that is what makes it ad hominem…”
1. You keep using that word. I do not think it means what you think it means.
2. Even if you count land use change emissions, CO2 from fossil fuels is currently about 85% of all human CO2 emissions, not “about half.”
Bud wrote, “And they are only estimates and models, some based on dubious sources, and sometimes guesswork… These estimates and models are only hypotheses and theories…”
That’s a fair criticism ONLY of “land use change” emissions.
It’s nonsense for emissions from fossil fuels. To know how much CO2 is produced by completely burning a given quantity of coal, oil or natural gas, all you have to do is calculate how many carbon atoms there are in the fuel. That’s not “models” or “guesswork,” it’s just very basic chemistry.
Bud wrote, “It may be worthwhile to point out that the NOAA-Scripps Global Monitoring Laboratory (GML Mauna Loa) is only one of several GML labs measuring CO2… they do not propose, nor do I, that GML Mauna Loa is the true average net global CO2 concentration.”
Of course that’s covered on my site. The largest deviation in annually averaged measured CO2 levels from the MLO measurements, at any high quality measurement site, is only about 4 ppmv lower. MLO annual averages are probably only about 1 ppmv above the true global average.
Bud wrote, “CO2 concentration in air varies widely and chaotically”
Only at ground level. That’s why measurements are done at high elevations, on ocean-facing mountainsides.
LikeLike
David, I won’t be publishing any more of your comments. It’s not worth my time and effort to read them and parse through them.
For example, your quibbles about 2.58 ppm and ppmv. The NOAA Mauna Loa laboratory reported the average annual increase in CO2 from 2019 to 2020 was 2.58 ppm. That is 414.24 ppm for 2020 minus 411.66 ppm for 2019. 414.24 – 411.66 = 2.58 ppm. That is 2.58 X 10^-6. Then multiply by 100 to get the percentage. 2.58 X 10^-6 x 1 X 10^2 = 2.58 X 10^-4 % or 0.000258%. For 2020, the increase in CO2 due to the sum of all CO2 sources (both natural and human) and all CO2 sinks (both natural and human) was only 0.000258%. Human CO2 emissions for 2020 was some unknown and poorly estimated amount less than 0.000258% of atmosphere.
This means the increase in CO2 for 2020 due to all CO2 sources and sinks, human and natural, was only 0.6% of the total CO2 for 2020. That is, 2.58 ppm divided by 414.24 ppm = 0.006228. As a percent that is 0.6228%. Net human CO2 emissions for 2020 (i.e., net human CO2 emissions minus net human CO2 absorption) cannot exceed 0.6% of net global average CO2 concentration for 2020, since that 0.6% includes the net sum of CO2 from all CO2 sources and all CO2 sinks, natural and human.
But you said: “or about 2.41 ppmv for CO2 sources & sinks just in 2020.”
The NOAA Global Monitoring Laboratory which reports the data we are discussing reports in micromoles of CO2 per mole of dry air, according to them, and according to them, they call that ppm, and they measured 2.58 micromoles per mole of dry air, which they report as ppm. And, they even provide an explanation for why they do not use ppmv. ppm is not the same as ppmv.
You even quote: “Here are the figures:
Year  MLO_yr  Increment  MLO_1Q   Increment
2019  411.66             411.723
2020  414.24   +2.58     414.230   +2.507
2021  416.45   +2.21     416.637   +2.407
2022 418.56 +2.11 418.760 +2.123”
This is just an example. My comment here is almost a repeat of my last reply to your comment.
The rest of your message is just nonsense. As I have told you, the references you give for calculations of fossil fuel CO2 emissions are irrelevant, immaterial, a distraction from the point. Again, fossil fuels CO2 emissions, land use etc. and also the absorbance of those emissions is already included in the 2.58 ppm NET increase for 2020. My post and NOAA’s measurements are NET global emissions, in other words all CO2 emissions from all sources minus all absorptions of CO2 from all sinks is already included in the NET number. Your quibbling about this or that report or this or that calculation of CO2 from fossil fuels is useless and off point. NET means NET.
For example: I wrote and provided the calculation “Net human emission for 2020 did not exceed 2.58 ppm.”
You wrote: “That’s wrong. It would only be true if natural sinks did not exceed natural sources, which is not the case. From production statistics for fossil fuels and cement, we know that in 2020 human fossil CO2 emissions were about 4.36 ppmv (BP) or 4.52 ppmv (GCP).”
What you wrote is irrelevant and not worth the time to read. The number measured by NOAA is 2.58 ppm and it is NET CO2. Since that 2.58 ppm is NET CO2 from all sources and sinks, natural and human, then by definition of the words, NET human emissions cannot possibly exceed 2.58 ppm for 2020.
By the way, repeatedly writing that someone is “wrong” is an example of an ad hominem. You do it all the time. An argument or debate is not about whether the debater is right or wrong. That only diverts focus from the actual subject being debated. It is a type of logical fallacy known as ad hominem.
Goodbye David.
LikeLike
Dave, once again, I laugh that you might think that your comment here deserves a response. LOL. Do you know what ad hominem is?
LikeLike