


Bud’s comments:
(1) Natural gas is definitely the way to go. Earth will never run out of natural gas unless life is extinguished. Methane is still being produced in enormous quantity by the natural degradation of biological molecules in the environment. Known natural deposits of methane hydrates or clathrate are more that 1000 times larger than all other “fossil fuels” ever discovered. Imagine if humanity had used the financial and intellectual resources which have already been wasted on solar and wind energy but instead used these resources on R&D of methane hydrates and engineering of subsea recovery of this natural gas resource. Lithium and uranium resources will be exhausted long before natural gas. Also, assuming a worst case return to a deep ice age, natural gas could be recovered from continental shelves and sea floor even if higher latitudes were again buried in ice sheets. Even if practical fusion is developed, natural gas and reformates of natural gas may be the most practical portable fuels. Theoretically endless fusion energy could be used to generate natural gas and reformates from garbage, sewage and green waste.
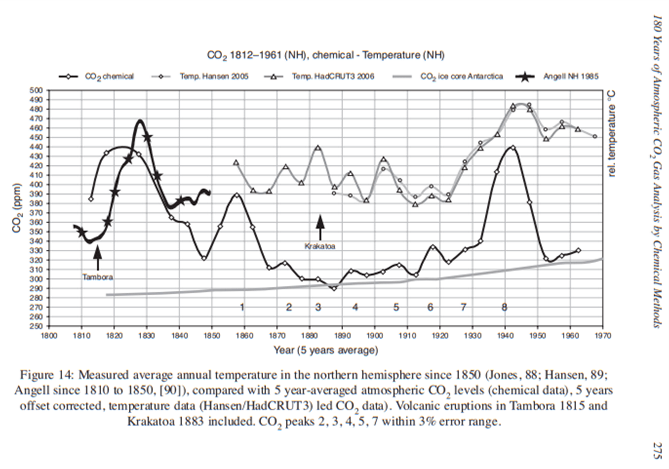
(2) 280 ppm for a pre-industrial CO2 concentration is a dubious number. Better to use for example a 1970’s CO2 measurement from NOAA-Scripps Mauna Loa or Hadley CRU. Ice core proxy measurements are problematic. Ernst George Beck compiled the works of many scientists who measured CO2 by chemical means and the variation is very high. (attached graphic) G.S. Callender ‘cherry picked’ the pre-industrial CO2 value.(attached graphic.)
(3) Per NOAA-Scripps Global Monitoring Laboratory Mauna Loa (attached spreadsheet), for example, average global atmospheric CO2 concentration for 2020 was 414.24 ppm. For 2019 it was 411.66 ppm. This is a one-year annual net CO2 increase of 2.58 ppm. This 2.58 ppm increase was the same for 2020 to 2021. NOAA proclaimed these 2.58 ppm “amounts tied for 5th-highest annual increase in NOAA’s 63-year record.” Let’s consider what that really means. This 2.58 ppm increase is the net increase in CO2 due to the combined sum of all CO2 sources and CO2 sinks, natural and human. It is the residual difference of all CO2 emissions minus all CO2 absorptions, natural and human. This means the net increase due to humans could not have exceeded 2.58 ppm for year 2020 or year 2021. Dividing 2.58 ppm by 414.24 ppm equals 0.006228 or 0.6%. Thus 0.6% is the maximum possible net contribution from humans as a percent of total CO2 concentration; that is, on average for 2020, net human CO2 did not exceed 0.6% of net global CO2 concentration. 2.58 ppm is 2.58 divided by 1,000,000 or 0.00000258, which is 0.000258%.
In other words, the net human CO2 contribution to air for 2020 did not exceed 0.000258% of air. No one is concerned about the other 99.4% of the CO2, but UN, WEF, national governments, bankers, world corporations and NGO’s and virtue signalers are claiming they want to spend trillions of dollars on the 0.6% of CO2 of which only part of that 0.6% is human produced. It is no surprise that UN, WEF, national governments, bankers, world corporations and NGO’s and virtue signalers are steadily losing credibility and the confidence of the general population.
(4) When the net global atmospheric CO2 concentration, i,e. the total CO2, is de-trended, then the apparent dramatic increasing trend in atmospheric CO2 disappears. This is the work of emeritus professor of business statistics, Dr. Jamal Munshi. The effect of incorrectly, repetitiously counting cumulative data is removed. Correlations between cumulative values are spurious. The apparent correlation does not capture the uncertainty in cumulative annual CO2 means. (ref. 1)
“the correlation in the source data derives from a shared long term drift in time and not from a relationship between their annual fluctuations net of long term trend.” (ref 2 page 6)
“In statistics, a spurious relationship or spurious correlation is a mathematical relationship in which two or more events or variables are associated but not causally related, due to either coincidence or the presence of a certain third, unseen factor (referred to as a “common response variable.” (Wikipedia)
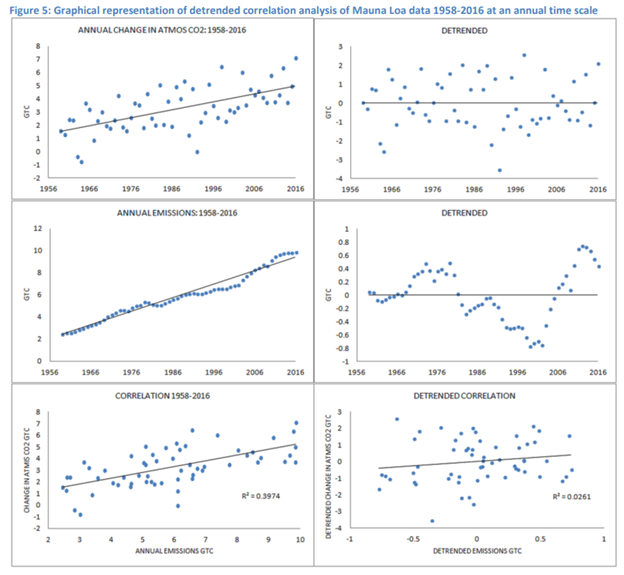
Above graphic (ref 2, page 7)
References:
(1) Munshi, Jamal, The Spuriousness of Correlations between Cumulative Values (February 1, 2016). Available at SSRN: https://ssrn.com/abstract=2725743 or http://dx.doi.org/10.2139/ssrn.2725743
(2) Munshi, Jamal. Responsiveness of Atmospheric CO2 to Fossil Fuel Emissions: Updated (July 5, 2017). Available at SSRN: https://ssrn.com/abstract=2997420 or http://dx.doi.org/10.2139/ssrn.2997420

Pingback: Irish Climate Science Forum (ICSF) Comments on the Climate Action Plan 2023 (CAP23) - Climate- Science.press