
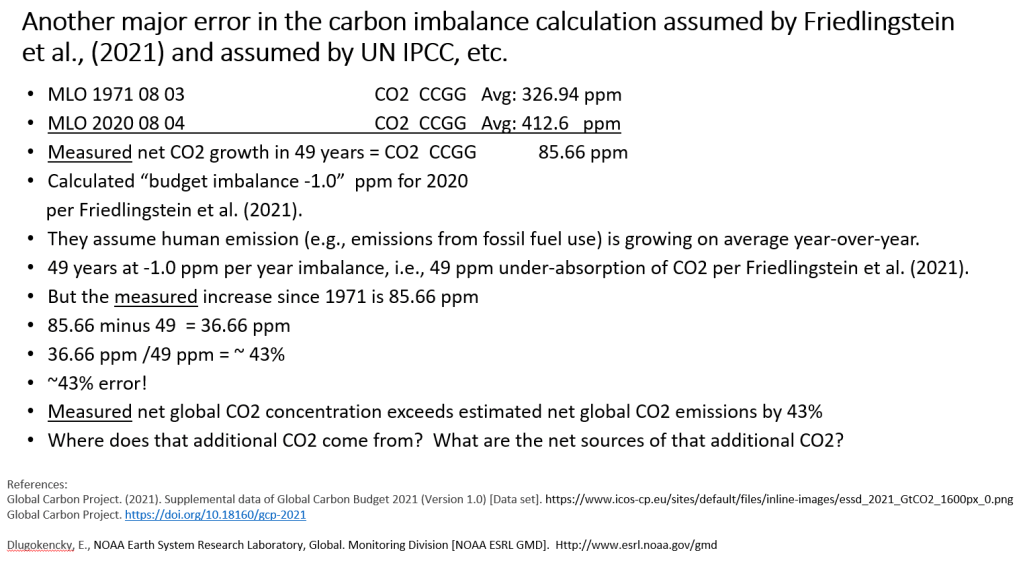
CCGG indicates that these are individual flask measurements of CO2 concentration by the Mauna Loa laboratory. The two averages were each an average of 4 flask measurements each day.
CCGG indicates that these are individual flask measurements of CO2 concentration by the Mauna Loa laboratory. The two averages were each an average of 4 flask measurements each day.
This site uses Akismet to reduce spam. Learn how your comment data is processed.

I’m sure you know this Bud, but for. the benefit of those who don’t, the increase in atmospheric CO2 is due to emission from the ocean surface, not anthropogenic emissions and lags, does not lead, temperature change.
Here’s a bit of information I acquired some time ago for the benefit of those who believe the surface temperature of the oceans is measurable to some scientific level of precision and capable of comparisons to tenths or even hundredths of a degree or better over the entire surface of the World’s oceans:
Concerning sea surface temperatures.
Note that in the decades before the advent of the significant coverage of the oceans by the buoy networks, the ocean temperature data was acquired in the main by ship’s engine room water inlet temperature data or by measuring the temperature in buckets thrown over the side on a rope.
Ship’s engine cooling water inlet temperature data is acquired from the engine room cooling inlet temperature gauges by the engineers at their convenience, there is no protocol for the recording of the temperatures.
There is no standard for either the location of the inlets with regard especially to depth below the surface, the position in the pipework of the measuring instruments or the time of day the reading is taken and the position of the temperature sensor may be anywhere between the hull of the ship and the engine cylinder head itself.
The instruments themselves are of industrial quality, their limit of error in °C per DIN EN 13190 is ±2 deg C. for a class 2 instrument or sometimes even ±4 deg. C, as can be seen in the tables here: DS_IN0007_GB_1334.pdf . After installation it is exceptionally unlikely that they are ever checked for calibration.
It is not clear how such readings can be compared with the readings from buoy instruments specified (optimistically IMO) to a limit of error of tenths or even hundreds of a degree C. or why they are considered to have any value whatsoever for the purposes to which they are put, which is to produce historic trends apparently precise to 0.001 deg. C upon which spending of literally trillions of £/$/whatever are decided.
But hey, this is climate “science” we’re discussing so why would a little thing like that matter?
LikeLike
David, your comment is so very true. Thanks. Decades ago, I was not able to sample CO2 with precision in dead still water, and NIST is still not able to do that today. It can only be does by careful extent of reaction experiments. Sea water sample is useless for this purpose. It is a nightmare of sampling errors. Keeling (of the Keeling curve and lab) was scientific director for some of these cruises. He says in one of his papers that there were as many variations of sample collection as there were passengers aboard ship.
Broader even that this, I am attempting to avoid temperature correlations as much as possible. They will fall out of the work eventually. You might be interested in some of the work or Dr. Mototaka Nakamura, a very experience climate modeler. He points out that barely 5% of earth’s surface has been sampled with enough precision to calculate a mean. Secondly, temperature and CO2 cannot be disentangled. The many simultaneous partial differential equations can be solved but uncertainly in the result makes the answer useless. Thus, I am focused on DSP of CO2 data alone.
Sampling CO2 (and temperature) in the liquid surface thin layer is already difficult and then explaining the result theoretically requires serious math. The liquid thin layer is only molecules thick. Disturb the surface in any way and the CO2 sample error increases significantly. I am content to let temperature remain a pure variable unknown; there are too many co-variables. The algorithm for the phase transition at the liquid thin layer is my target. The diffusion rates of absorption and emission through the surface are not equal, and we can observe that characteristic universally around the world under any temperature range and pressure range; this offers the opportunity to differentiate and characterize an algorithm. Starting from CO2 diffusion is starting from an intensive property of matter, i.e., molecular weight, whereas temperature, energy, thermodynamics are more complex derivatives until we get to the level of unified field theories, etc. Already in molecule thin layer, in the phase state transitions of CO2 there are already multiple accompanying temperature transitions. Attempts to broaden of empirical observation to either water or air layers even at one centimeter depth or altitude involves multiple averaging of averages which destroys precision and accuracy. There is a transition from the virials of chemical potential for non-ionized CO2 gas in water over to phase transition of the gas into air.
Calculating an global equilibrium CO2 concentration based on global air temperatures or SSTs from buoys is a futile exercise. Nevertheless, it is be a standard fall back excuse, even though it is disallowed by the poor precision in sampling SST. Two CO2 molecule be only angstroms apart can be diffusing simultaneously in opposite directions, into and out of the surface (and this can be measured analogously by gases which do not react with water). Thus a dynamic equilibrium is required in all calculations for the phase state transitions. We cannot say that global CO2 concentration was once stable at the some preindustrial concentration but is now this is higher concentration today, and then jump to conclusions that this change is caused by humans; that is laughably absurd. Even with very elaborate and expensive instruments in the lab we cannot make a precise DIRECT measurement of CO2 gas in water, much less a CO2 gas measurement from samples of ice which are 100 to 1000 to millions of year which has been through who knows what changes. Averages are precision killers. By comparison, sampling and measuring CO2 in air is a piece of cake.
LikeLiked by 1 person