
Carbon dioxide data from NOAA-Scripps Global Monitoring Laboratory at Mauna Loa (MLO) for 2021 are not yet finalized as I write this. According to MLO for 2020, net CO2 from all sources and sinks, human and natural, on average increased only 2.58 ppm for the year 2020. That is only 0.000258% of the atmosphere and it includes all CO2 from all sources and sinks, natural and human.
In other words, human-produced CO2 emitted to the atmosphere minus human-produced CO2 absorbed by the environment DID NOT EXCEED a 0.000258% increase for 2020. Net global CO2 atmospheric concentration measured at MLO was 414.24 ppm. (That’s the annual mean for MLO in 2020 minus annual mean for MLO in 2019. 414.24 ppm minus 411.66 ppm equals 2.58 ppm.)
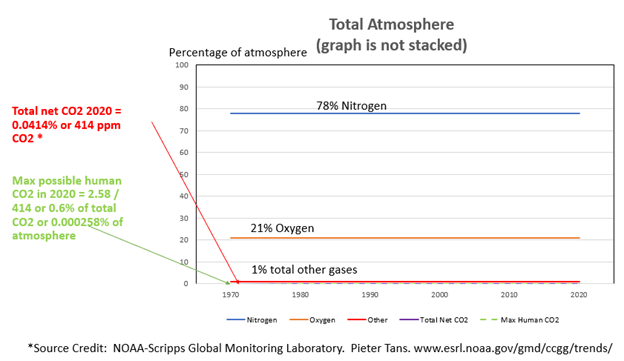
Then 2.58 ppm divided by 414.24 ppm is 0.0062 or 0.6%. This means that the annual increase for 2020 in total CO2 is only 0.6% of the total CO2 in air and this 0.6% percent increase includes CO2 from all sources and sinks, natural and human. In other words, the net increase of CO2 for 2020 due to humans did not exceed 0.6% of the total CO2 in air.
NOAA, etc. writes statements such as:
“From 2000 through 2018, CO2 emissions to the atmosphere from burning of fossil fuels rose from 6.7 PgC yr –1 to 10.2 PgC yr-1 (1 petagram of carbon is 1015 gC, or 1 billion metric tons C, or 3.67 billion metric tons CO2). Global fossil fuel emissions have increased steadily year upon year, with the exception of 2009 following the global economic recession and 2014-2016 when emissions held nearly constant (Figure 1).” https://gml.noaa.gov/ccgg/carbontracker/index.php#north_america
Near the bottom of the same page linked above, NOAA informs the reader of important uncertainties in their estimate of CO2 emission flux, including that it contains guesswork. This may be the most useful information on that webpage.
NOAA and other human-CO2-caused-global-warming proponents typically neglect to inform the reader that CO2 added to the air in excess of the Henry’s Law partition ratio is absorbed by the environment. An increase in CO2 gas concentration in air results in a 1:1 proportional increase in CO2 solubility in ocean water. If net global CO2 emissions increases by 2.58 ppm per year, then net global CO2 absorption will increase by 2.58 ppm per year. And vice versa. They also neglect to inform that the MLO-measured-and-reported CO2 concentration, the defacto “gold standard”, is in fact the net residual difference between two very much larger natural CO2 fluxes, CO2 emission flux and CO2 absorption flux.
The trend of increasing net global CO2 (i.e., the MLO rate of change of net global CO2 atmospheric concentration, aka the Keeling Curve slope) cannot be caused by humans, as is shown below.
There are many natural sources of CO2 and many natural sinks for CO2 and both are orders of magnitude larger than net human CO2 emissions. Human CO2 emissions are being absorbed into the environment as they are emitted by humans, and then that CO2 is re-emitted and re-absorbed repeatedly. In the real world, the net global average CO2 concentration in air (and even more so the net global human CO2 emission) cannot be distinguished from noise in the measurement system. In the real world away from computer models, atmospheric CO2 concentration is determined by nature not by humans; by addition or removal of CO2 gas, humans can neither increase nor decrease net global average CO2 concentration except as a temporary local perturbation.
CO2 measurements typically ignore the variability of both CO2 and air in the natural environment. MLO is essentially a lab environment; its measurements are diligently made, accurate and precise for that lab location and for its purpose. The unit of measure used by MLO is ppm, that is CO2 parts per million parts of air. As measured by MLO and NOAA Global Monitoring Labs, their unit measured is micromoles of CO2 gas per mole of dried air, which is the same as ppm. But it (ppm) is measurement and ratio of moles, not a volume measurement.
MLO data files are accompanied by the following data description.
“See http://www.esrl.noaa.gov/gmd/ccgg/trends/ for additional details. The uncertainty in the global annual mean is estimated using a monte carlo technique that computes 100 global annual averages each time using a slightly different set of measurement records from the NOAA ESRL cooperative air sampling network. The reported uncertainty is the mean of the standard deviations for each annual average using this technique. Please see Conway et al. 1994 JGR vol. 99 no. D11. for a complete discussion. CO2 expressed as a mole fraction in dry air micromol/mol abbreviated as ppm.”
Thus, there are major problems using the diligently measured “gold standard” MLO data of net global average CO2 atmospheric concentration as commonly, and repeatedly reported worldwide, when these data are compared to CO2 from wet air sample. First, MLO have removed a huge variability in CO2 data by removing water and water vapor from the sample. CO2 gas is highly soluble in water and the solubility varies significantly with temperature. The concentration of water and water vapor in air is more than 10 times larger than the concentration of CO2, and humidity is highly variable. In practice, if MLO did not remove the water from the air samples, then the variability in the data would be so large that accurate and precise routine CO2 measurements would be impossible; this is but one reason they use a molar mass measurement micromoles of CO2 per mole of dry air (ppm) instead of a volume measurement such as micrograms CO2 per liter of air (or ppmv); ppm and ppmv are not equivalent units.

Secondly, ppmv is calculated by dividing the volume of one component by the total volume of the sample and then multiplying by one million. But in natural air the water and water vapor content are highly variable (near zero to 2 or more percent) which means the volume of the air is significantly variable. On the other hand, when water is frozen out of the air samples, then the volume is stable. Freezing the sample releases CO2 gas in the water or aerosolized with water vapor.
Thirdly, CO2 gas, water vapor and water have overlapping infrared spectra. Various types of infrared instruments have been used at MLO over the years. Deconvolution of these overlapping data is probably possible by digital signal analysis, but impractical for routine on-line repetitious sampling.
Fourth, MLO routinely and diligently and frequently calibrates its systems with CO2 standard samples bottles prepared by the Keeling Lab at Scripps Institution of Oceanography. If MLO measured volumetric wet natural air samples, then MLO would need standard sample bottles containing varying amounts of water vapor and water. Water reacts with the standard bottles which would need to be carefully temperature controlled. The standard bottles and the system would need to be so frequently re-calibrated during the day that the process would be impractical for routine online sampling.
Global warming proponents Kevin E. Trenberth and Christian J. Guillemot (1994) state in The total mass of the atmosphere: https://agupubs.onlinelibrary.wiley.com/doi/abs/10.1029/94JD02043
“Thus the mean mass of water vapor is 1.25×10¹⁶ kg and the dry air mass is 5.132×10¹⁸ kg, corresponding to a mean surface pressure of 982.4 mbar. Overall uncertainties are ∼0.1 mbar or 0.5×10¹⁵ kg in total mass and about double those values for atmospheric moisture content.”
These global warming proponents point out that the mass variability is high for dry air, but variability of moisture content is about double of that mass variability.
According to this estimate (Trenberth and Guillemot, 1994), the atmosphere contains about 5.132 X 10¹⁸ kilograms of dry air, which is 5.132 X 10²¹ grams of dry air. Then 3.9 X 10⁻⁶ grams of CO2 (the annual increase per gram of dry air) multiplied times the estimated 5.132 X 10²¹ grams of dry air in the total atmosphere results in an estimated increase in the atmosphere of 2.0 X 10¹⁶ grams of CO2 for 2019-2020 due to all sources and sinks, natural and human. Sounds like a big, scary increase. But wait, there is more that is rarely if ever mentioned.
Thus we have 2.0 X 10¹⁶ grams of CO2 added to the atmosphere (from all sources natural and human), which are diluted immediately and continuously into 2 natural, continuous, opposite vector-directional fluxes of CO2. One flux is CO2 absorbed into the environment, primarily ocean surface, which is 71% of earth’s surface. The other flux is CO2 emission flux, also primarily from ocean surface. CO2 gas is continuously colliding with earth’s surface, thus continuously being simultaneously emitted and absorbed at all normal earth temperatures. Although we do not know precisely the size of these two continuous CO2 vector fluxes, the MLO-measurement (i.e., the Keeling Curve) is the record of the rate of change of the net annual difference between these two giant fluxes, i.e., 2.0 X 10¹⁶ grams of CO2 per year for 2019-2020, which is the slope of the Keeling curve expressed in grams of CO2 per year for 2019-2020.

The above “Keeling Curve” would appear flat (as in the graph further above) if the left hand axis represented the whole atmosphere instead of 0.01% of the atmosphere.
Notice, for the estimated mass of the atmosphere (5.132 X 10²¹ grams of dry air), that the net annual increase in CO2 (i.e., the MLO-measured net annual difference between the two fluxes, or 2.0 X 10¹⁶ grams of CO2 for the year for 2019-2020) is more than 5 times larger than the estimated average annual fossil fuel CO2 emissions (3.67 X 10¹⁵ grams of fossil fuel CO2 emissions for 2000 through 2018, from the NOAA reference above). This is CO2 fossil fuel emissions only, not net emissions. Net emission is emissions minus absorptions; net CO2 fossil-fuel emissions would be about half of the estimated 3.67 X 10¹⁵ grams of average annual fossil fuel CO2 emissions.
Thus the two slopes (2.0 X 10¹⁶ grams of net CO2 per year versus 3.67 X 10¹⁵ grams of fossil fuel CO2 emissions per year) are diverging over time and the net global CO2 is growing faster. Therefore, it is not scientifically plausible that CO2 emissions from humans burning fossil-fuels are causing the slope of the Keeling curve.
The very slowly increasing slope of (a) the “gold standard” measured net global CO2 atmospheric concentration (i.e. the NOAA-Scripps Institute lab at Mauna Loa) cannot be caused by (b) the more slowly increasing slope of estimated CO2 emissions from fossil fuels combustion because the slope of (b) is less than (a) when (b) and (a) are on the same scale. The slopes are diverging with respect to time. There are no exceptions to this logic and math.
Also notice, for the estimated mass of the atmosphere (5.132 X 10²¹ grams of dry air), that the estimated uncertainty is 0.5 X 10¹⁸ grams, (i.e., 0.5×10¹⁵ kg from the above reference Trenberth and Guillemot, 1994). The uncertainty in the denominator of ppm (i.e., 0.5 X 10¹⁸ grams) is about 25 times larger than the numerator (2.0 X 10¹⁶ grams) AND this large uncertainty has not been propagated to the resulting ppm ratio. In other words, the ~414 ppm measurement, although precisely measured in the lab sample, is highly uncertain in the real world; it does not represent the high variability of CO2 concentration in normal atmosphere. With an uncertainty which is 25 times larger, it is highly improbable that the ~400 ppm signal could be distinguished from noise in a sufficiently powered sampling of the natural environment. Here is a reference on propagation of uncertainty: https://chem.libretexts.org/Bookshelves/Analytical_Chemistry/Supplemental_Modules_(Analytical_Chemistry)/Quantifying_Nature/Significant_Digits/Propagation_of_Error

Pingback: Henry’s Law controls CO2 concentration, not humans | budbromley
Pingback: Energy and Environmental Review: November 7, 2022 - Master Resource
Pingback: The Media Balance Newsletter: 7/11/22 - Australian Climate Sceptics blog
Pingback: AWED MEDIA BALANCED NEWS: We cover COVID to Climate, as well as Energy to Elections. - Dr. Rich Swier
Pingback: About those errors in the climate change „gold standard “ - Climate- Science.press
Here are a couple of slides on CO2 from a series I am working on called 20 Questions
The second shows the divergence between atmospheric (red) and BP fossil fuel emissions (Blue)
Why did neither atmospheric CO2 concentrations nor global temperature data reflect the significant fall in fossil fuel emissions during the Great Depression, the Great Financial Crisis and the Pandemic, or the tripling of emissions in 2002 when China began to carbonise its industries?
[cid:image002.jpg@01D8EE92.EB4B34C0]
If Fossil Fuels drive increase in atmospheric CO2 why does the annual rate of change of the latter fluctuate so much compared to the steady rise in atmospheric CO2 concentrations, from ~1.0 ppme in 1965 to >5.0 ppme in 2021? Atmospheric CO2 never falls and ranges from 0.5 ppm to 3.5 ppm.
[cid:image003.jpg@01D8EE92.EB4B34C0]
LikeLike
Aloha Howard. Please, can you take a look at my post here from the perspective of editing it, or tuning it, or rewriting it, reformating it, etc. so that it is more understandable and simple for the lay reader? You have excellent wordsmithing skills.
LikeLike
Bud,
You want me to re-write your post – or mine?
Can you display my graphs? As without them the words will not be enough, or will become tortuously long??
Thanks
Howard
LikeLiked by 1 person
Aloha Howard. My post. Your wordsmithing is excellent and mine needs help.
Yes, I can see your graphs.
LikeLike
Bud, thank you for your continued analysis on this critically misunderstood area of science. I hope more people rid themselves of television and all perfidious media. Those with an IQ of 100 or more are only lazy if they don’t make an effort on this subject.
LikeLike