
Her show Ep. 89 is one for the history books. Get to know her on Rumble at Jewels Jones Live
Alternative site:
https://jewelsjoneslive.com/portfolio-item/dnc-sewage-show-a-political-rendezvous-ep-89/
Her show Ep. 89 is one for the history books. Get to know her on Rumble at Jewels Jones Live
Alternative site:
https://jewelsjoneslive.com/portfolio-item/dnc-sewage-show-a-political-rendezvous-ep-89/

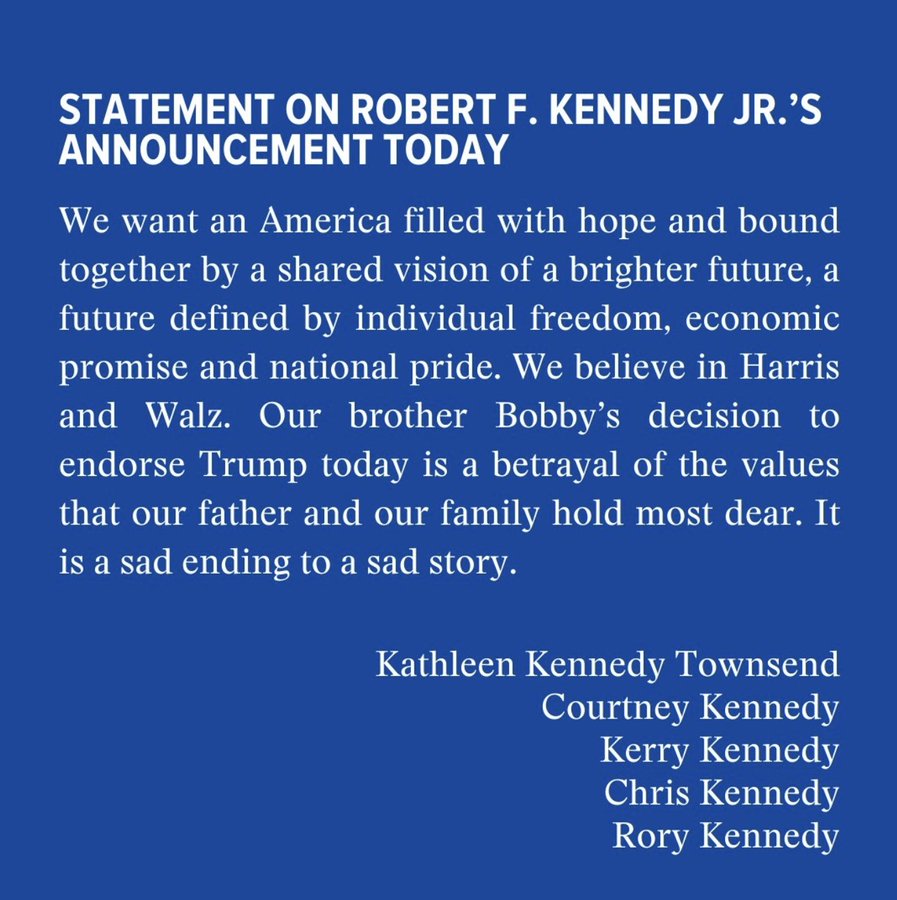
An open letter to Kerry Kennedy: You people are awful. Despite your family’s checkered past and horrible behavior of so many of the men, Americans have stood with you out of loyalty, sentimentality, and too often, grief. Despite the questionable establishment of your family’s wealth, the treatment of Marilyn Monroe, the general womanizing, the abandonment of Mary Jo Kopechne to her death, allegations of rape, one could go on and on, but the point is your family has stayed loyal and protective of family members who have done the most appalling of things. But the moment one of your own acts on his conscience for this country you attempt to throw him to the wolves and publicly condemn him. Never a word for the trail of abused or abandoned women left behind by a Kennedy, but because one of your men supports Trump in an effort to make the lives of Americans better, that alone is beyond the pale. In your ugly treatment of your brother you reveal the rot that has broken the hearts of the American people so many times over the years. Beyond that, the economic destruction of American families is something your family would never truly understand. You are not touched by the worry about having enough gas to get to work, or whether or not you can afford eggs this week, if you’ll be safe walking your own neighborhood, or if your child will be safe in their urban public school or even if they will know how to read and write while collecting their diploma. You keep doing civil rights work and public service virtue signaling. But in the meantime, make a pledge to not keep doing damage as Americans are simply looking for a way to reclaim their own futures, the safety of their families, and knowing that maybe, just maybe, they can leave their children a little better off w a future they can rely on. The condition of this country should shock everyone, even if their name is Kennedy. We know it at least shocks one of you who, like us, has had enough of the fear and hopelessness assigned to us for generations. Americans are happy to see Bobby on our side as we refuse to comply and will not go gentle into the catastrophes to which we are expected to succumb. Instead, with Trump and all who join us, we will fight, fight, fight!
Quote

Kerry Kennedy
@KerryKennedyRFK
Aug 23
I am sharing a personal statement that my family and I have made in response to my brother’s announcement.
2.2M Views
“I must not fear. Fear is the mind-killer. Fear is the little-death that brings total obliteration. I will face my fear. I will permit it to pass over me and through me. And when it has gone past I will turn the inner eye to see its path. Where the fear has gone there will be nothing. Only I will remain.” ~ Frank Herbert, Author of the Dune novels
“The only thing we have to fear is fear itself” ~ U.S. President Franklin Delano Roosevelt, his first inaugural address after election by a nation in panic.
Dr Reiner Fuellmich, Dr. Mike Yeadon, Joseph Molitorisz, and Meredith Miller in conference.
In this episode of ICIC, Dr. Reiner Fuellmich analyzes the modus operandi of all responsible governments worldwide and in strange synchronicity of the beginning of the so-called Corona Pandemic with Meredith Miller, holistic coach, author and Dr. Mike Yeadon, scientist and former vice president of Pfizer and Joseph Molitorisz, philosopher.
They shed light on the psychological and inhumane methods used to panic, confuse and, with the help of the media, prevent the entire world population from using common sense to make a reality check. The viciousness of those in charge is evident not only in their own behavior during the pandemic, as they obviously had no qualms or fears about shamelessly breaking all the established rules of social distancing for their population themselves, but also in how they pretended to provide medical care for people supposedly infected with covid, leading to death for very many.
How to protect yourself from such psychological tricks and methods? Meredith Miller is terrific on this!
Because the fear and panic-inducing narratives are not breaking even currently. Why, even after three years, people cannot let go of their fear of a virus, although there is so much information on the table that it is a matter of lies and deceptions? How will this greatest crime against humanity be dealt with and how and by whom can those responsible be held legally accountable? The most important thing in such situations is to remain calm and level-headed. Fear is the greatest enemy mankind has.
The covid plandemic was an orchestrated, global campaign of fear. And in 2024 the evil people are back at it again.
“Fear is the mind killer,” as the Bene Gesserit sisterhood teach throughout 20 novels in the Dune series of novels by Frank Herbert, Brian Herbert and Kevin J. Anderson. This notion suggests that fear has a profound and destructive influence on one’s mental state. When faced with fear, the mind is consumed by it, leading to:
This concept emphasizes the importance of acknowledging and facing fear, rather than allowing it to dominate and destroy one’s mental faculties. By permitting fear to pass and reflecting on its path, individuals can potentially break free from its debilitating effects.
The Dune series is considered by many to be the best selling science fiction novel in history. The first book in the series was rejected by at least 20 mainstream publishers before its eventual publication by Chilton, an auto-manual company, in 1965.
What is “stakeholder capitalism”?
In 2020, G20 governments, in collusion with the World Economic Forum’s Stakeholders, discretely and undemocratically enacted a global ten-year transition to an authoritarian political system, called Stakeholder Capitalism.
After propagating a Marxist idea that black and trans people are oppressed and indoctrinating us to fear climate change, the Stakeholders are mandating their pre-planned political system, which Klaus Schwab alleges is better for ‘people and planet’.
Will we push back before A.I. takes our jobs, our wealth shifts to the Stakeholders and we become vulnerable to tyranny? Join tech entrepreneur, Richard Jeffs, as he investigates The Great Reset transition to Stakeholder Capitalism. His 53 minute video is viewable online here: https://yellow.forum/t/the-new-normal-film-2020-dir-richard-jeffs/43
Our governments have enacted a new political system, and most of us are blissfully unaware. It’s called Stakeholder Capitalism, and I’ve just spent sixteen months producing an independent series of feature films that investigative it. Stakeholder Capitalism is the birthchild of the World Economic Forum’s executive chairman, Klaus Schwab. Founded in 1971, Schwab launched the World Economic Forum (WEF) to globally enact “the Stakeholder concept”.
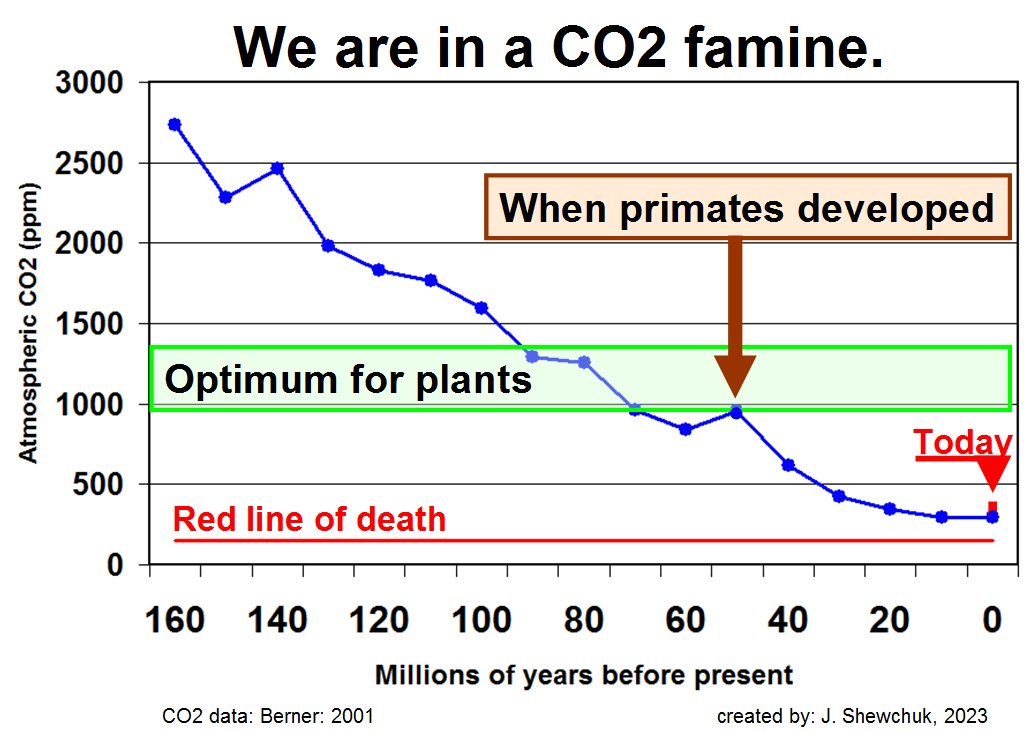
CO2 in air measures approximately 420 molecules per million molecules of air (ppm) or 0.0420% of air, making CO2 a trace gas in air. That CO2 gas is existentially necessary for life on earth. All green plants grow and survive by absorbing CO2 for photosynthesis from the air or water. The human contribution to that total net CO2 amount due to fossil fuels and all other human sources is estimated to be about 5% or less of the total net CO2 but unmeasurably small against the large variability in ~420 ppm background. CO2 gas does not accumulate in air. Increases in CO2 in air cause an offsetting equal increase in solubility of CO2 in water everywhere until the equilibrium is restored for the local surface temperature. Similarly, any reductions in CO2 by sequestration etc result in less CO2 solubility in water everywhere, resulting in CO2 emission from water to air exceeding CO2 absorptions into water until the equilibrium is restored for the local surface temperature. There is a short time lag (i.e., difference) between the rate of emission and the rate of absorption due to the large difference in densities of air and water.
Given the following statement from UN IPCC, it is illogical, unreasonable, malfeasant and/or misfeasant for governments, representatives, bureaucrats, UN IPCC, corporations, NGO’s, academia, etc to pursue reduction of gas CO2 in air such as the extremely expensive “net zero” plans. They rely on an assumed consensus without doing diligence required by their positions. Advocacy without due diligence is either malfeasant, misfeasant or both. In some cases, probably there is fraud. As far as I am aware, in such cases there is no statute of limitations.
The IPCC in its third report (2001) conceded: “In climate research and modelling, we should recognize that we are dealing with a coupled non-linear chaotic system, and therefore that the long-term prediction of future climate states is not possible. UN IPCC (Chapter 14, Section 14.2.2.2. )]”
Since “long term prediction of future climate states is not possible,” then how is not misfeasant or malfeasant to be spending billions of dollars per year to reduce CO2? And asking citizens to spend trillions of dollars per year out to 2050 in the future? “Net Zero” appears to be financially wrong and existentially dangerous to all life.
Massive class action cases are ahead. If there is justice, damages to the eventual plaintiff groups are already in the billions of dollars. Fraud is probable, which usually means payments for damages are tripled. But all of that money means nothing if geoengineering clouds and climate for net zero kills plant life.
Definition:
A ‘malfeasant’ is an individual who commits malfeasance. Malfeasance refers to the commission of an unlawful act or the performance of a lawful act in an unlawful manner, often by a public official. It’s a term used to describe the misuse of a public position for personal gain or other nefarious purposes.
‘Misfeasance’ is a legal term referring to the improper performance of a lawful action. It’s the act of doing something that is legally permissible but doing it in a wrong or improper manner, which may result in harm or damage. Unlike malfeasance, misfeasance doesn’t involve doing something unlawful; it’s more about the incorrect way in which a lawful action is carried out.
https://www.c-span.org/video/?c4351026/user-clip-clinton-1995-immigration-sotu
Bill Clinton
Transcript by C-SPAN
“All Americans, not only in the States most heavily affected but in every place in this country, are rightly disturbed by the large numbers of illegal aliens entering our country. The jobs they hold might otherwise be held by citizens or legal immigrants. The public service they use impose burdens on our taxpayers. That’s why our administration has moved aggressively to secure our borders more by hiring a record number of new border guards, by deporting twice as many criminal aliens as ever before, by cracking down on illegal hiring, by barring welfare benefits to illegal aliens. In the budget I will present to you, we will try to do more to speed the deportation of illegal aliens who are arrested for crimes, to better identify illegal aliens in the workplace as recommended by the commission headed by former Congresswoman Barbara Jordan. We are a nation of immigrants. But we are also a nation of laws. It is wrong and ultimately self-defeating for a nation of immigrants to permit the kind of abuse of our immigration laws we have seen in recent years, and we must do more to stop it.” – U.S. President Bill Clinton, 1995 State of the Union address to U.S. Congress
Video license bought from CSPAN.
This is a 1.5 hour documentary
Your feedback, comments, and questions on my site are most welcome on my site.
If this YouTube link is removed, please let me know. I have the video.
What is the right adjective for this? Please comment below. Is it deplorable? Despicable? Unacceptable? Detestable? Sinful? Inhuman? Unacceptable? Criminal?
Related posts on this blog:
This is a very important interview. Do not forget Afghanistan! Biden administration is funding ~$47 million per week to terrorists there now, terrorists who are very well armed and used the money to build 2,000 madrassas to train more terrorists.
Cmdr. Ahmad Massoud – The Assassination that Changed the World | SRS #121

You must be logged in to post a comment.