
In 1957 Roger Revelle, (Al Gore’s professor in what may have been Gore’s only science class) one of the early founding scientists at University of California San Diego, The Scripps Oceanographic Institute and the Mauna Loa Observatory along with Hans Suess authored an article (1) which associated human gas emissions with warming and suggested greenhouse gases could cause “global warming” over time. In 1988 NASA’s James Hansen et al authored an article introducing a theoretical “CO2 forcing parameter” and forecasting temperature increases three standard deviations above normal would be seen the 1990’s.(2) The United Nations Intergovernmental Panel Program on Climate Change (IPCC) claims that CO2 is causing rapid warming based on the CO2 forcing parameter.(3) The U.S. EPA has issued a Final Endangerment Finding that CO2 is dangerous, referencing the IPCC, and the U.S. Supreme Court has ruled that EPA is required by law (i.e. The Clean Air Act) to regulate if they find endangerment.
In most sciences, sets of data are analyzed using standard statistical methods including “predictive power,” “sensitivity,” “significance,” “confidence” and “credibility;” each of the foregoing words is an established statistical tool used by scientists, not rhetorical hype.
Associations between and among data sets are analyzed using standard statistical tests for correlations and cross correlations. A correlation between two variables is not proof of a causal relationship, however if there is in fact a causal relationship between the two variables, then there must be strong positive correlation. A negative, or inverse, correlation is strong evidence against a cause/effect linkage. Cause must occur prior to effects.
Empirical falsification is a premise of logic underlying all science. If a theorized data association is falsifiable by empirical (i.e. real-world) evidence, then the proposed hypothesis is false until the theorists produce a credible explanation for this evidence. For the global warming theory to be true, AGW proponents must produce credible evidence to support their theory and they must have credible explanations for all evidence that would falsify their theory. Proponents have already spent tens of billions of dollars in their unsuccessful effort to produce credible evidence of AGW. (4)
The cause must occur before the effect. Global warming proponents claim that, due to a theorized CO2 forcing parameter, increasing CO2 concentration in the atmosphere causes significant warming, but they have produced no empirical evidence. On the other hand, standard statistical methods applied to data from ice core samples from two locations in Antarctica (Vostok and Dome C (5,6)) clearly show CO2 trends are more strongly correlated with temperature trends that occurred in the past, that is, prior to the CO2 trend. In other words, warming trends occur before CO2 increasing trends. If CO2 is the cause of warming as AGW proponents claim, then increasing CO2 trends must be strongly correlated with warming trends occurring AFTER the CO2 trend; however, this is not the case. Therefore, AGW theory is empirically falsified.
In 2001 Manfred Mudelsee pointed to this fundamental problem in the global warming hypothesis in his peer reviewed journal article regarding measurements in the Vostok, Antarctica ice core samples. The preface to his article states, “Over the full 420 ka (420 thousand years) of the Vostok record CO2 variations lag behind atmospheric temperature changes in the Southern Hemisphere by 1.3 ka +/- 1.0 ka (1,300 years plus or minus 1,000 years.)”(5) All of the claims that the data or science supports man made warming are based on inaccurate, incomplete and misleading analysis.
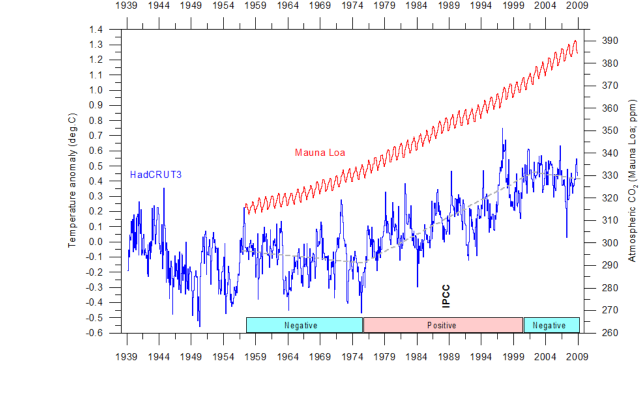
Another falsification of AGW: AGW theory proposes that a trend of increasing CO2 concentration forces an increasing trend in temperature through complicated multi-parameter feedback mechanisms. For this to be true, then CO2 concentration cannot be increasing while temperature is decreasing. Also, CO2 cannot be decreasing while temperature is increasing. In other words, CO2 cannot force both warming and cooling. However, both of these negative correlations occur repeatedly in the natural history record, as shown in the graph immediately below. Therefore, again, AGW theory is empirically falsified.
Proponents point to complicated theoretical climate models with many areas of uncertainty to justify their theory. But their climate models are hypothetical and they perform poorly; they do not meet statistical tests for scientific credibility.(6)
“Climate analysis which emphasizes AGW, assumes that when seasonal variability is integrated across the Earth’s surface and over a year, it averages out and thus can be ignored. This leads to the use of anomaly analysis, where monthly data is compared to independent long term monthly averages so that seasonal variability is removed from the results. The rationalization for doing this is that the expected trends are a tiny fraction of the monthly variability and they would be impossible to discern otherwise. See the section titled ‘Anomalies and Absolute Temperatures’ in (8) for James Hansen’s somewhat obtuse explanation. The side effect of this approach is that crucial behaviors of the climate system are obscured, leading to explanations for climate change that are consistent with the original flawed assumption and not the actual behavior. This is at the root of why so many are so mislead about what causes climate change.”(7)
AGW proponents find themselves in trouble…caught in scientific fraud… and their careers are dependent on continuing government and NGO grant money to study their failed AGW theory. Real-world evidence, just two examples among many are shown here, clearly falsifies AGW theory using only competently applied standard statistical techniques and without the use of theoretical modeling.
The diagram below shows the HadCRUT3 monthly global surface temperature estimate and the monthly atmospheric CO2 content according to the Mauna Loa [CO2] Observatory, on the Big Island of Hawaii. The Mauna Loa data series begins in March 1958. The dotted grey line indicates the approximate linear temperature trend, and the boxes in the lower part of the diagram indicate the relation between atmospheric CO2 and global temperature, negative or positive. The annotation “IPCC” indicate the establishment of the Intergovernmental Panel on Climate Change in 1988. Last month shown: September 2009. Last diagram update: 6 November 2009. Note that the data are from sources frequently used and cited by IPCC, the EPA and AGW proponents, not “skeptic” references. HadCRUT is the UK government’s climate research unit. As shown by the dotted grey line, the temperature trend declines during the 1950s into the 1970’s, meanwhile the red line (CO2 trend) increases. Around 2000, the temperature trend again declines while CO2 trend is increasing. These are examples of real world data falsifying the theory of human-caused global warming.
References:
(1) Revelle, R. and Suess, H. E. (1957) Tellus 9, 18-27.
(2) Hansen, J., I. Fung, A. Lacis, D. Rind, S. Lebedeff, R. Ruedy, G. Russell, and P. Stone(1988), Global Climate Changes as Forecast by Goddard Institute for Space Studies Three-Dimensional Model, J. Geophys. Res., 93(D8), 9341–9364.
(3) http://www.ipcc.ch/ipccreports/ar4-wg1.htm
Forster, P., V. Ramaswamy, P. Artaxo, T. Berntsen, R. Betts, D.W. Fahey, J. Haywood, J. Lean, D.C. Lowe, G. Myhre, J. Nganga, R. Prinn, G. Raga, M. Schulz and R. Van Dorland, 2007: Changes in Atmospheric Constituents and in Radiative Forcing. In: Climate Change 2007: The Physical Science Basis. Contribution of Working Group I to the Fourth Assessment Report of the Intergovernmental Panel on ClimateChange [Solomon, S., D.
Qin, M. Manning, Z. Chen, M. Marquis, K.B. Averyt, M.Tignor and H.L. Miller (eds.)]. Cambridge University Press, Cambridge, United Kingdom and New York, NY, USA. Hegerl, G.C., F. W. Zwiers, P. Braconnot, N.P. Gillett, Y. Luo, J.A. Marengo Orsini, N. Nicholls, J.E. Penner and P.A. Stott, 2007: Understanding and Attributing Climate Change. In: Climate Change 2007: The Physical Science Basis. Contribution of Working Group I to the Fourth Assessment Report of the Intergovernmental Panel on Climate Change [Solomon, S., D. Qin, M. Manning, Z. Chen, M. Marquis, K.B. Averyt, M. Tignor and H.L.Miller (eds.)]. Cambridge University Press, Cambridge, United Kingdom and New York, NY,USA.
(4) CLIMATE MONEY, The Climate Industry: $79 billion so far – trillions to come Joanne Nova, Science & Public Policy Institute.
Click to access climate_money.pdf
(5) Mudelsee, M. 2001 The phase relations among atmospheric CO2
content, temperature & global ice volume over the past 420 ka. Quaternary Science Reviews 20, 583-589.
(6) KOUTSOYIANNIS, A. EFSTRATIADIS, N. MAMASSIS & A. CHRISTOFIDES “On the credibility of climate predictions” Hydrological Sciences–Journal–des Sciences Hydrologiques, 53 (2008).
http://www.atypon-link.com/IAHS/doi/abs/10.1623/hysj.53.4.671
(7) http://www.palisad.com/co2/eb/eb.html George White
(8) GISS (Goddard Institute for Space Studies) Surface Temperature Analysis, Anomalies and Absolute Temperatures. http://data.giss.nasa.gov/gistemp/

The GreenHouse Effect Anti-Theory
By reflecting away 30% of the incoming solar energy the atmosphere/albedo makes the earth cooler than it would be without the atmosphere much like that reflective panel behind a car’s windshield.
Greenhouse theory has it wrong.
The non-radiative processes of a contiguous participating media, i.e. atmospheric molecules, render ideal black body LWIR from the surface impossible. The 396 W/m^2 upwelling from the surface is a “what if” theoretical calculation without physical reality. (refer to: TFK_bams09)
Greenhouse theory has it wrong.
Without the 396 W/m^2 upwelling there is no 333 W/m^2 GHG energy up/down/”back” loop to “warm” the earth. (refer to: TFK_bams09)
Greenhouse theory has it wrong.
Man caused climate change is negated by these three points. Hysterical speculations over sea levels, ice caps, glaciers, extreme weather, etc. are irrelevant noise.
Zero greenhouse effect, Zero CO2 global warming and Zero man caused climate change.
Geoengineering
One popular geoengineering strategy proposed for countering imaginary global warming/climate change is through reducing net solar heating by increasing the earth’s albedo.
This increase is accomplished by various physical methods, e.g. injecting reflective aerosols into the atmosphere, spraying water vapor into the air to enhance marine cloud brightening, spreading shiny glass spheres around the poles with the goal of more reflection thereby reducing the net amount of solar energy absorbed by the atmosphere and surface and cooling the earth.
More albedo and the earth cools.
Less albedo and the earth warms.
No atmosphere means no water vapor or clouds, ice, snow, vegetation, oceans and near zero albedo and much like the moon the earth bakes in that 394 K, 121 C, 250 F solar wind.
These geoengineering plans rely on the atmosphere cooling the earth thereby exposing the error of greenhouse theory which says the atmosphere warms the earth and with no atmosphere the earth becomes a -430 F frozen ball of ice.
Zero greenhouse effect, Zero CO2 global warming and Zero man caused climate change.
Space – the Hotter Frontier
One of the heated issues underlying greenhouse theory is whether space is hot or cold.
Greenhouse theory says that without an atmosphere the earth would be exposed to a near zero outer space and become a frozen ice ball at -430 F, 17 K.
Geoengineering techniques that increase the albedo, the ISS’s ammonia refrigerant air conditioners, an air conditioner in the manned maneuvering unit, space suits including thermal underwear with chilled water tubing, UCLA Diviner lunar data and Kramm’s models (Univ of AK) all provide substantial evidence that outer space is relatively hot.
But outer space is neither hot nor cold.
By definition and application temperature is a relative measurement of the molecular kinetic energy in a substance, i.e. solid, liquid, gas. No molecules (vacuum), no temperature. No kinetic energy (absolute zero), no temperature. In the void & vacuum of outer space the terms temperature, hot, cold are meaningless, like dividing by zero, undefined. Same reason there is no sound in space – no molecules.
However, any substance capable of molecular kinetic energy (ISS, space walker, satellite, moon, earth) placed in the path of the spherical expanding solar photon gas at the earth’s average orbital distance will be heated per the S-B equation to an equilibrium temperature of: 1,368 W/m^2 = 394 K, 121 C, 250 F.
Like a blanket held up between a camper and campfire the atmosphere reduces the amount of solar energy heating the terrestrial system and cools the earth compared to no atmosphere.
This intuitively obvious as well as calculated and measured scientific reality refutes the greenhouse theory.
Zero greenhouse effect, Zero CO2 global warming and Zero man caused climate change.
Conclusion
Since the earth is actually hotter without an atmosphere, radiative greenhouse effect goes straight into the historical trash bin of failed theories and all the handwavium, pseudo-science, thermodynamic nonsense pretending to explain it follows close behind.
If my anti-theorem is incorrect why so and how so, bring science.
If my anti-theorem is correct contemplate the consequences.
Nick Schroeder, BSME CU ’78, CO PE 22774
LikeLiked by 1 person
Reblogged this on Climate- Science.press.
LikeLike
Reblogged this on kommonsentsjane and commented:
Reblogged on kommonentsjane/blogkommonsents.
For your information.
kommonsentsjane
LikeLiked by 1 person
And what is the CO2 point?
LikeLike
RGHE theory exists only to explain why the earth is 33 C warmer with an atmosphere than without. Not so. The average global temperature of 288 K is a massive WAG at the ”surface.” The w/o temperature of 255 K is a theoretical S-B ideal BB OLR calculation at the top of – the atmosphere. An obviously flawed RGHE faux-thermodynamic “theory” pretends to explain a mechanism behind this non-existent phenomenon, the difference between two made up atmospheric numbers.
But with such great personal, professional and capital investment in this failed premise, like the man with only a hammer, assorted climate “experts” pontificate that every extreme, newsworthy weather or biospheric flora or fauna variation just must be due to “climate change.”
The Earth’s albedo/atmosphere doesn’t keep the Earth warm, it keeps the Earth cool. As albedo increases, heating and temperature decrease. As albedo decreases, heating and temperature increase.
Over 11,600 views of my five WriterBeat papers and zero rebuttals. There was one lecture on water vapor, but that kind of misses the CO2 point.
Step right up, bring science, I did.
http://writerbeat.com/articles/14306-Greenhouse—We-don-t-need-no-stinkin-greenhouse-Warning-science-ahead-
http://writerbeat.com/articles/15582-To-be-33C-or-not-to-be-33C
http://writerbeat.com/articles/19972-Space-Hot-or-Cold-and-RGHE
http://writerbeat.com/articles/16255-Atmospheric-Layers-and-Thermodynamic-Ping-Pong
http://writerbeat.com/articles/15855-Venus-amp-RGHE-amp-UA-Delta-T
LikeLike
There is no way in physics that the earth could be giving off more energy and matter than it receives. The atmosphere is an intermediary step of hydrogen and helium and a few other things exiting earth’s influence..that is losing energy and matter to space. As I recall, it was about 50,000 tons per year net outflow from earth to space. These are light gases, which can exit the atmosphere. But everything breaks down to light gases.
LikeLike
Massive handwavium.
LikeLiked by 1 person
Not sure what your mean. Who is waving hands?
LikeLike
It’s bloviating, prestidigitation, smoke & mirrors. Making something simple complex to obfuscate.
LikeLiked by 1 person
K-T and assorted clone diagrams of atmospheric power flux balances include a GHG up/down/”back” LWIR energy loop of about 330 W/m^2 which violates three basic laws of thermodynamics: 1) energy created out of thin air, 2) energy moving (i.e. heat) from cold to hot without added work, and 3) 100% efficiency, zero loss, perpetual looping.
One possible defense of this GHG loop is that USCRN and SURFRAD data actually measure and thereby prove the existence of this up/down/”back” LWIR energy loop. Although in many instances the net 333 W/m^2 of up/down/”back” LWIR power flux loop exceeds by over twice the downwelling solar power flux, a rather obvious violation of conservation of energy.
And just why is that?
Per Apogee SI-100 series radiometer Owner’s Manual page 15. “Although the ε (emissivity) of a fully closed plant canopy can be 0.98-0.99, the lower ε of soils and other surfaces can result in substantial errors if ε effects are not accounted for.”
Emissivity, ε, is the ratio of the actual radiation from a surface and the maximum S-B BB radiation at the surface’s temperature. Consider an example from the K-T diagram: 63 W/m^2 / 396 W/m^2 = 0.16 = ε. In fact, 63 W/m^2 & 289 K & 0.16 together fit just fine in a GB version of the S-B equation.
What no longer fits is the 330 W/m^2 GHG loop which vanishes back into the mathematical thin air from whence it came.
“Their staff is too long. They are digging in the wrong place.”
“There is no spoon.”
And
The up/down/”back” GHG radiation of RGHE theory simply:
Does
Not
Exist.
Which also explains why the scientific justification of RGHE is so contentious.
https://www.linkedin.com/feed/update/urn:li:activity:6384689028054212608
LikeLiked by 1 person
Thanks for your interesting comments. Yes, I have seen several of those diagrams. Full of errors. While there is a small amount of atomic decay on earth, producing energy, it is overwhelmed by the amount of incoming energy from the sun. Net of everything, earth’s energy balance can only be negative, losing energy and matter to space, cooling. So much for AGW.
LikeLike
It seems to me that we agree that RGHE is nonsense.
Earth’s albedo, which exists only because of the atmosphere, reflects away 30% of the incoming solar energy. The albedo does not actually cool the earth but makes it less hot which yields the same result. Variations in the albedo play a major, it not the major, role in the state of the climate.
The atmosphere’s thin layer of gases insulate and create a thermal gradient same as the wall of a house per U A dT.
My explanation is based on first principles which even the lay public can understand.
LikeLiked by 1 person
Makes sense. One point though. The earth would still have albedo even without an atmosphere. Gases in the atmosphere absorb and re-emit light which is reflected and emitted from the surface and from adjacent air molecules. So, some of that energy that would be immediately reflected and emitted to space is temporarily held in the atmosphere. Yes, “he atmosphere’s thin layer of gases insulate and create a thermal gradient same as the wall of a house per U A dT.” But the oceans serve the same insulator role. They retain far more energy (1000X) than the atmosphere.
The atmosphere, and specifically water in the atmosphere and CO2 to much less extent, retain heat at night, keeping night air warmer than it would have been without those gases. Again it plays a buffering or insulation role, temporarily altering conditions. Then, thankfully, the sun come up. Otherwise life as we know it would not be here.
The math in the NASA/NOAA diaghrams is wrong, at least the ones I have seen. Earth’s energy balance with space is negative. We are losing energy, slowly thankfully, thanks to our insulators, primarily the oceans and the air.
Thanks for your comments.
LikeLike
But the sans-atmosphere albedo would be similar to the moon’s – about 0.12. And less energy reflected back into space makes for a hotter surface. The moon peaks around 390 K, close to the theoretical maximum of 394 K. https://springerplus.springeropen.com/articles/10.1186/2193-1801-3-723
USCRN data show that the ground and 1.5 m air temperature rise together as the sun rises while air cools rapidly when the sun sets and at night becoming and remaining colder than the ground. This actual data contradicts the RGHE notion that the air warms the ground.
The K-T diagram in Trenberth et al 2011jcli24 displays 8 different opinions about the balance. 7 of those opinions see cooling.
LikeLike
Trenberth’s papers are unnecessarily complicated. I think he confuses himself. The sun is pumping 340 Watts per square meter (W/m^2) of electromagnetic energy energy into earth daily. That’s a global average including day/night, seasonality, latitude and angle of light incidence. That means it is also the maximum electromagnetic energy which can be output by the earth into space. Thus, earth’s energy balance problem is bounded. Energy generated by the earth itself, such as by atomic decay, is trivial in comparison. We are not looking at any effects of gravity. We have income at 340 W/m^2, where does it go and the rate, in what time period does it go. We know that the albedo and any other emissions of energy and mass cannot exceed 340 W/m^2. We cannot simply assume that the energy balance is negative and build a model. Because almost every other variable could be different under that one constraint (which is actually two constraints), and we cannot test by experiments the entire model as we would like. For the same reason, we cannot build a model where the energy balance is positive. Untestable hypotheses are pretty useless. However, we can make a model that assumes we are in balance, and from that basis run tests in the real world. One test would be to continuously measure transmission in air of microwave, infrared, uv and visible light, versus time. It’s important to document other real world conditions as much as possible and consistently, but most of that is being done already. Once the known values of those variables under real life are built into a spreadsheet, then we have a testable model. We want to know, for example, when the humidity changes, what are the values of all the other variables.
LikeLike
The sun delivers an average 1,368 W/m^2 at this orbital distance. Spreading/averaging that over the spherical ToA, 1,368/4=342, is a really dumb model. That’s not remotely similar to how the earth actually heats and cools.
For a more realistic model see this link.
https://www.linkedin.com/feed/update/urn:li:activity:6369927560008212481
LikeLike
No it is not a dumb model. 1,368 W/m^2 only applies to points perpendicular to sun. It does not apply to half the planet that is in darkness at any point in time, for example. It does not apply to latitudes in the far north or far south, for example. It does not apply to seasonality.
LikeLike
The sunlight strikes the sphere at an oblique angle. The irradiation perpendicular to ToA is cos latitude * 1,368. The irradiation is similar to a dome shaped heater ranging from max directly overhead to zero at the poles. The earth oscillates and rotates beneath.
Any given surface point sees 700 W/m2 from summer to winter. See LinkedIn power point.
Heats the lit side only, loses heat outward 24/7. Pretty obvious in USCRN data.
LikeLike
The earth’s energy balance numbers are academic. We know incoming and outgoing are closely balanced. We also know that trends of increasing CO2 follow, not lead, trends of increasing temperature. AGW alarmists proposed a theory where increasing CO2 causes (triggers, forces) increasing temperature. Real world data has falsified their theory. http://file.scirp.org/Html/3447.html
LikeLike
The 396 W/m^2 upwelling and net 333 W/m^2 GHG energy loop as shown on the K-T power flux balance diagram (Figure 10 Trenberth et al 2011jcli24) is calculated using the S-B equation with an assumed emissivity of 1.0 and an average surface temperature of 16 C, 289 K. Because of the conductive/convective/advective/latent heat participating processes of the atmospheric molecules the actual and correct radiative emissivity is about 0.16, i.e. 63/396.
This GHG energy loop is an inappropriate calculation with zero physical reality.
Without this energy loop the radiative greenhouse effect theory fails.
Without RGHE man-caused climate change does not exist.
It’s called “science.”
Don’t be frightened, spit out the Kool-Aid and give it a try.
LikeLiked by 1 person